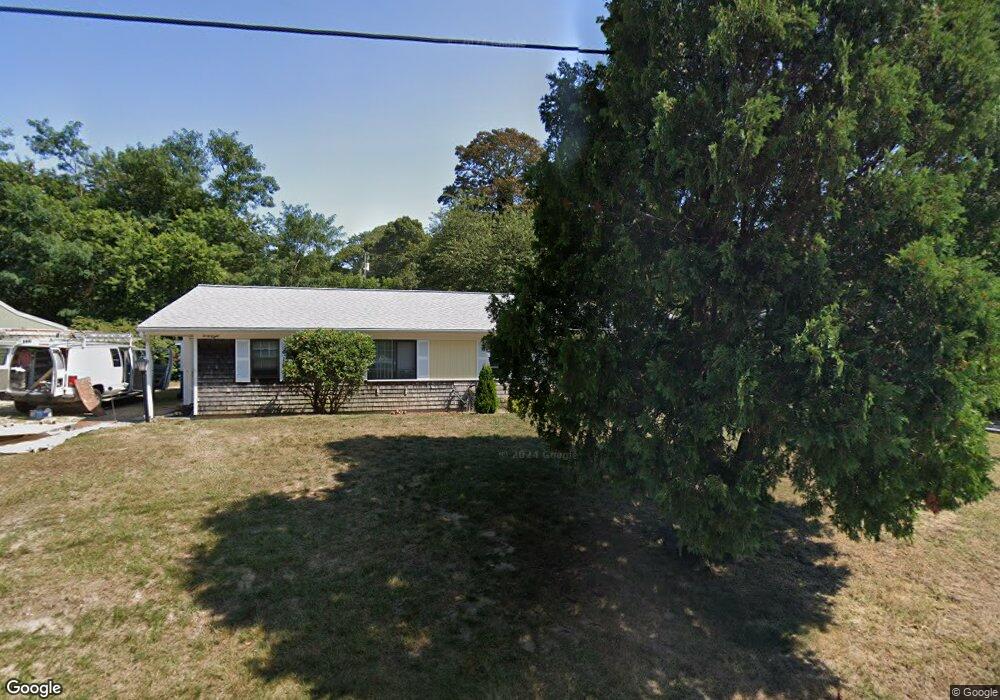
50 Katharyn Michael Rd Unit 57B Yarmouth Port, MA 02675
Yarmouth Port NeighborhoodEstimated Value: $312,000 - $427,869
2
Beds
2
Baths
1,064
Sq Ft
$355/Sq Ft
Est. Value
About This Home
This home is located at 50 Katharyn Michael Rd Unit 57B, Yarmouth Port, MA 02675 and is currently estimated at $377,967, approximately $355 per square foot. 50 Katharyn Michael Rd Unit 57B is a home located in Barnstable County with nearby schools including Dennis-Yarmouth Regional High School, St. Pius X. School, and Trinity Christian Academy of Cape Cod.
Ownership History
Date
Name
Owned For
Owner Type
Purchase Details
Closed on
Aug 1, 2023
Sold by
Flynn Joan M
Bought by
Flynn Daniel G
Current Estimated Value
Purchase Details
Closed on
Jul 14, 2023
Sold by
Flynn Raymond P and Flynn Daniel G
Bought by
Flynn Joan M
Purchase Details
Closed on
Feb 12, 2018
Sold by
Flynn Joan M
Bought by
Flynn Joan M and Flynn Raymond P
Purchase Details
Closed on
Dec 1, 2009
Sold by
Shelton Sandra
Bought by
Flynn Joan M
Purchase Details
Closed on
Jul 13, 2000
Sold by
Kempton Rt and Kempton Peter G
Bought by
Shelton Sandra
Home Financials for this Owner
Home Financials are based on the most recent Mortgage that was taken out on this home.
Original Mortgage
$70,000
Interest Rate
8.5%
Mortgage Type
Purchase Money Mortgage
Purchase Details
Closed on
May 26, 1989
Sold by
State St Bk & Tr Co
Bought by
Kempton Jean E
Create a Home Valuation Report for This Property
The Home Valuation Report is an in-depth analysis detailing your home's value as well as a comparison with similar homes in the area
Home Values in the Area
Average Home Value in this Area
Purchase History
| Date | Buyer | Sale Price | Title Company |
|---|---|---|---|
| Flynn Daniel G | -- | None Available | |
| Flynn Joan M | -- | None Available | |
| Flynn Joan M | -- | -- | |
| Flynn Joan M | $127,500 | -- | |
| Shelton Sandra | $89,000 | -- | |
| Kempton Jean E | $99,000 | -- |
Source: Public Records
Mortgage History
| Date | Status | Borrower | Loan Amount |
|---|---|---|---|
| Previous Owner | Kempton Jean E | $90,000 | |
| Previous Owner | Kempton Jean E | $10,000 | |
| Previous Owner | Kempton Jean E | $70,000 |
Source: Public Records
Tax History Compared to Growth
Tax History
| Year | Tax Paid | Tax Assessment Tax Assessment Total Assessment is a certain percentage of the fair market value that is determined by local assessors to be the total taxable value of land and additions on the property. | Land | Improvement |
|---|---|---|---|---|
| 2025 | $2,602 | $367,500 | $0 | $367,500 |
| 2024 | $2,513 | $340,500 | $0 | $340,500 |
| 2023 | $2,189 | $269,900 | $0 | $269,900 |
| 2022 | $2,503 | $272,700 | $0 | $272,700 |
| 2021 | $1,937 | $202,600 | $0 | $202,600 |
| 2020 | $2,209 | $220,900 | $0 | $220,900 |
| 2019 | $2,119 | $209,800 | $0 | $209,800 |
| 2018 | $1,644 | $159,800 | $0 | $159,800 |
| 2017 | $1,601 | $159,800 | $0 | $159,800 |
| 2016 | $1,595 | $159,800 | $0 | $159,800 |
| 2015 | $1,479 | $147,300 | $0 | $147,300 |
Source: Public Records
Map
Nearby Homes
- 1 Barnacle Rd
- 8 Rowley Ln
- 24 Minnetuxet Way
- 209 Union St
- 32 Deveau Ln
- 933-935 W Yarmouth Rd
- 882 W Yarmouth Rd
- 86 Pompano Rd
- 25 Oak Glen
- 23 Dauphine Dr
- 16 Warren Rd Unit 16
- 16 Warren Rd
- 25 Oak Glen Village Unit 25
- 2 Pine Grove
- 43 Canterbury Rd
- 7 Forest Gate Unit 7
- 371 Route 6a
- 44 Stratford Ln
- 30 W Woods Cir Unit 30
- 34 Kates Path
- 50 Katharyn Michael Rd
- 48 Katharyn Michael Rd
- 48 Kathryn Michael Unit 48
- 46 Katharyn Michael Rd
- 44 Katharyn Michael Rd
- 44 Katharyn Michael Rd Unit A
- 46 Katharyn Michael Rd Unit B
- 46 Katharyn Michael Rd Unit 55B
- 16 Cobb Ave
- 18 Cobb Ave
- 18 Cobb Ave Unit 59A
- 16 Cobb Ave Unit 16
- 16 Cobb Ave Unit 59 B
- 39 Mary David Rd Unit 1
- 39 Mary David Rd
- 37 Mary David Rd
- 39 Mary David Rd Unit 39
- 39 Mary David Rd Unit 56B
- 20 Cobb Ave
- 22 Cobb Ave