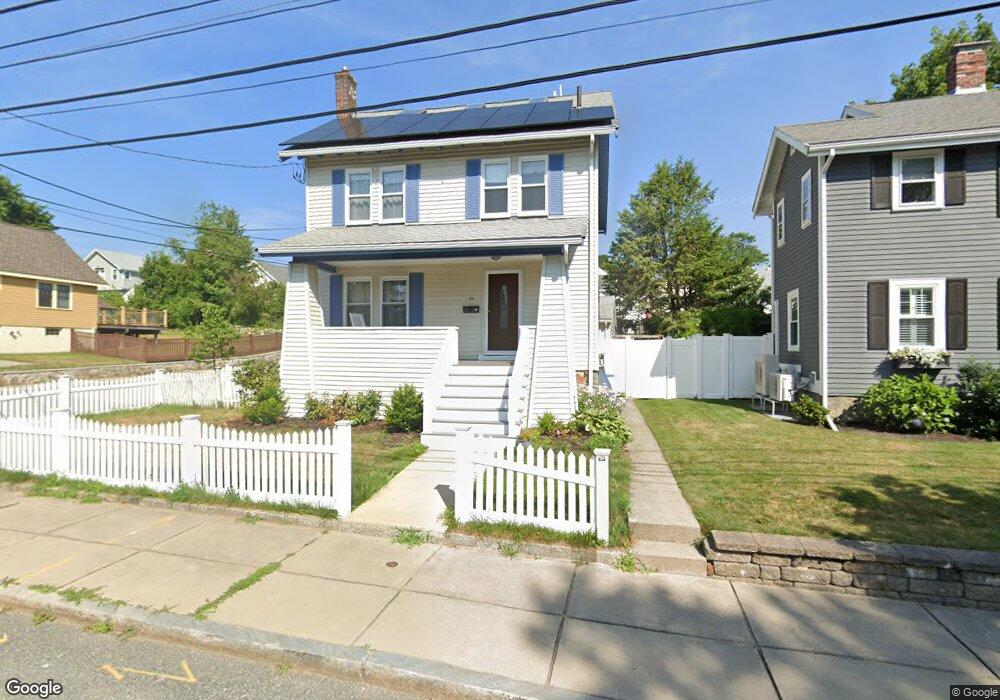
50 Keith St West Roxbury, MA 02132
West Roxbury NeighborhoodEstimated Value: $843,000 - $972,000
4
Beds
2
Baths
1,478
Sq Ft
$612/Sq Ft
Est. Value
About This Home
This home is located at 50 Keith St, West Roxbury, MA 02132 and is currently estimated at $904,003, approximately $611 per square foot. 50 Keith St is a home located in Suffolk County with nearby schools including St Theresa School, Catholic Memorial School, and The Roxbury Latin School.
Ownership History
Date
Name
Owned For
Owner Type
Purchase Details
Closed on
May 22, 2006
Sold by
Ruggiero Joseph and Rivera Susan A
Bought by
Kelly Catherine C and Hopkins Michael A
Current Estimated Value
Home Financials for this Owner
Home Financials are based on the most recent Mortgage that was taken out on this home.
Original Mortgage
$364,000
Interest Rate
6.42%
Mortgage Type
Purchase Money Mortgage
Purchase Details
Closed on
Nov 14, 2003
Sold by
Murray Charissa M and Cronin Brian W
Bought by
Lucero Susan A and Ruggiero Joseph
Home Financials for this Owner
Home Financials are based on the most recent Mortgage that was taken out on this home.
Original Mortgage
$331,200
Interest Rate
5.81%
Mortgage Type
Purchase Money Mortgage
Purchase Details
Closed on
Jun 18, 1997
Sold by
Finlay Mary C and Luttman Robert J
Bought by
Cronin Brian W and Murray Charissa M
Purchase Details
Closed on
Sep 26, 1988
Sold by
Faller Ethel M Est
Bought by
Finlay Mary C
Create a Home Valuation Report for This Property
The Home Valuation Report is an in-depth analysis detailing your home's value as well as a comparison with similar homes in the area
Home Values in the Area
Average Home Value in this Area
Purchase History
| Date | Buyer | Sale Price | Title Company |
|---|---|---|---|
| Kelly Catherine C | $455,000 | -- | |
| Lucero Susan A | $414,000 | -- | |
| Cronin Brian W | $190,750 | -- | |
| Finlay Mary C | $157,500 | -- |
Source: Public Records
Mortgage History
| Date | Status | Borrower | Loan Amount |
|---|---|---|---|
| Open | Finlay Mary C | $352,000 | |
| Closed | Kelly Catherine C | $364,000 | |
| Previous Owner | Finlay Mary C | $331,200 |
Source: Public Records
Tax History Compared to Growth
Tax History
| Year | Tax Paid | Tax Assessment Tax Assessment Total Assessment is a certain percentage of the fair market value that is determined by local assessors to be the total taxable value of land and additions on the property. | Land | Improvement |
|---|---|---|---|---|
| 2025 | $9,850 | $850,600 | $201,400 | $649,200 |
| 2024 | $8,414 | $771,900 | $205,800 | $566,100 |
| 2023 | $7,896 | $735,200 | $196,000 | $539,200 |
| 2022 | $7,272 | $668,400 | $178,200 | $490,200 |
| 2021 | $6,875 | $644,300 | $174,700 | $469,600 |
| 2020 | $6,338 | $600,200 | $158,400 | $441,800 |
| 2019 | $6,027 | $571,800 | $147,600 | $424,200 |
| 2018 | $5,548 | $529,400 | $147,600 | $381,800 |
| 2017 | $5,495 | $518,900 | $147,600 | $371,300 |
| 2016 | $5,542 | $503,800 | $147,600 | $356,200 |
| 2015 | $5,678 | $468,900 | $164,700 | $304,200 |
| 2014 | $5,565 | $442,400 | $164,700 | $277,700 |
Source: Public Records
Map
Nearby Homes
- 9 Carroll St
- 331 Vermont St
- 105 Chesbrough Rd
- 577 Baker St Unit 577
- 183 Temple St
- 89 Dwinell St
- 59 Chesbrough Rd
- 76 Vermont St
- 539 Lagrange St
- 28 Dow Rd
- 76 Potomac St
- 73 Dent St Unit 1
- 340 Baker St Unit 1
- 579 Baker St Unit 579
- 845 Lagrange St Unit 4
- 865 Lagrange St Unit 5
- 14 Sanborn Ave
- 1216 Vfw Pkwy Unit 40
- 1214 Vfw Pkwy Unit 30
- 1214 Vfw Pkwy Unit 37