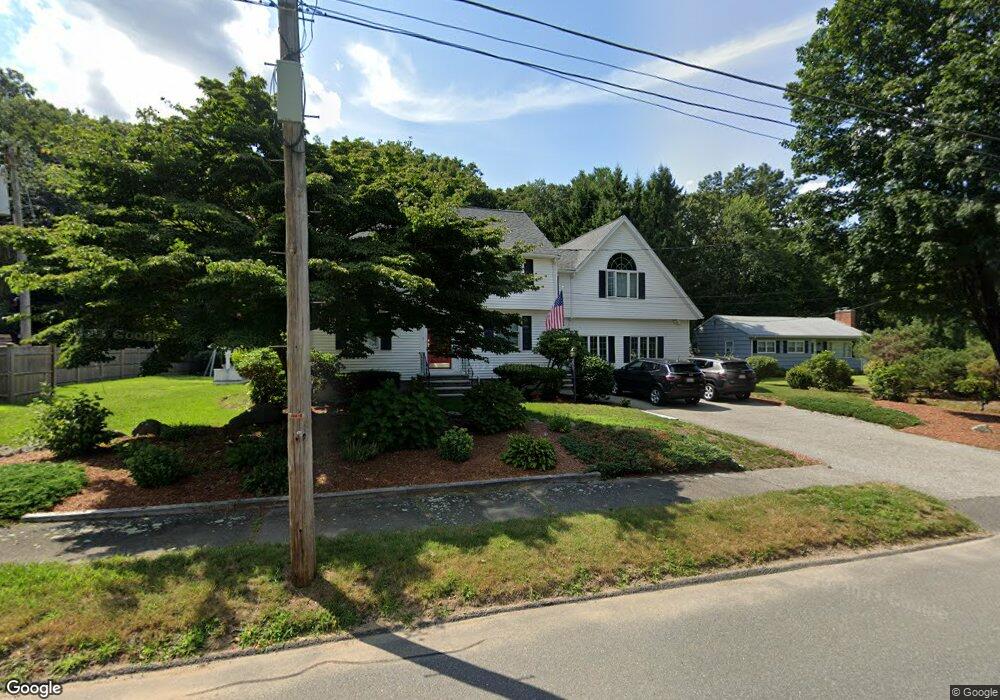
50 Kieran Rd Reading, MA 01867
Estimated Value: $985,000 - $1,424,000
4
Beds
3
Baths
2,760
Sq Ft
$426/Sq Ft
Est. Value
About This Home
This home is located at 50 Kieran Rd, Reading, MA 01867 and is currently estimated at $1,174,959, approximately $425 per square foot. 50 Kieran Rd is a home located in Middlesex County with nearby schools including Wood End Elementary School, Arthur W. Coolidge Middle School, and Reading Memorial High School.
Ownership History
Date
Name
Owned For
Owner Type
Purchase Details
Closed on
Sep 15, 1995
Sold by
Cerra Anthony M and Cerra Gail L
Bought by
Finigan Joseph L and Finigan Lisa D
Current Estimated Value
Purchase Details
Closed on
Oct 21, 1988
Sold by
Dorlando Leonard F
Bought by
Cerra Anthony M
Create a Home Valuation Report for This Property
The Home Valuation Report is an in-depth analysis detailing your home's value as well as a comparison with similar homes in the area
Home Values in the Area
Average Home Value in this Area
Purchase History
| Date | Buyer | Sale Price | Title Company |
|---|---|---|---|
| Finigan Joseph L | $238,000 | -- | |
| Cerra Anthony M | $252,500 | -- |
Source: Public Records
Mortgage History
| Date | Status | Borrower | Loan Amount |
|---|---|---|---|
| Open | Cerra Anthony M | $397,000 | |
| Closed | Cerra Anthony M | $219,000 |
Source: Public Records
Tax History
| Year | Tax Paid | Tax Assessment Tax Assessment Total Assessment is a certain percentage of the fair market value that is determined by local assessors to be the total taxable value of land and additions on the property. | Land | Improvement |
|---|---|---|---|---|
| 2025 | $11,355 | $996,900 | $502,300 | $494,600 |
| 2024 | $11,227 | $957,900 | $482,500 | $475,400 |
| 2023 | $10,883 | $864,400 | $435,100 | $429,300 |
| 2022 | $10,481 | $786,300 | $395,500 | $390,800 |
| 2021 | $4,155 | $741,600 | $379,000 | $362,600 |
| 2020 | $9,972 | $706,000 | $360,600 | $345,400 |
| 2019 | $9,574 | $672,800 | $343,500 | $329,300 |
| 2018 | $9,856 | $634,900 | $324,000 | $310,900 |
| 2017 | $9,967 | $599,300 | $305,600 | $293,700 |
| 2016 | $7,343 | $506,400 | $273,800 | $232,600 |
| 2015 | $6,888 | $468,600 | $253,100 | $215,500 |
| 2014 | $6,677 | $453,000 | $244,500 | $208,500 |
Source: Public Records
Map
Nearby Homes
- 119 Van Norden Rd
- 68 Sanborn Ln
- 150 Grove St
- 16 Briarwood Ave
- 50 Forest St
- 99 Grove St
- 98 John Carver Rd
- 32 Granger Ave
- 28 Nutter Rd
- 11 Clover Cir Unit A
- 42 Main St Unit 22
- 36 Main St Unit 1
- 44 Grandview Rd
- 27 Audubon Rd
- 584 Woburn St
- 41 Marcus Rd
- 0 Charles St Unit 72374573
- 141 Belmont St
- 2 Inwood Dr Unit 1005
- 203 Lowell St Unit 218