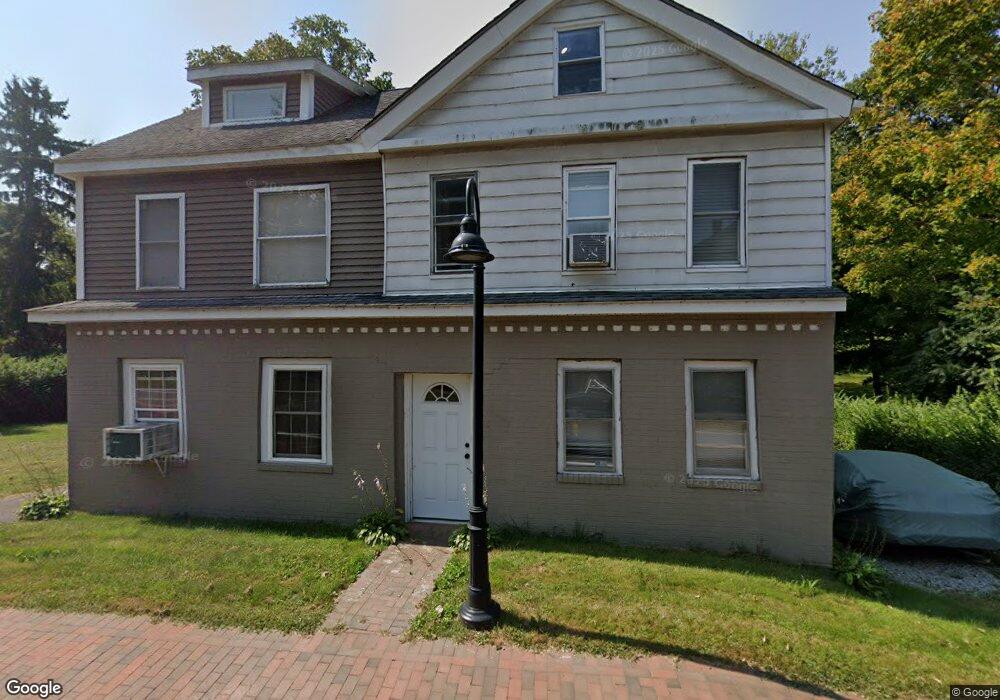
50 Main St Deep River, CT 06417
Estimated Value: $343,000 - $415,000
3
Beds
2
Baths
1,930
Sq Ft
$197/Sq Ft
Est. Value
About This Home
This home is located at 50 Main St, Deep River, CT 06417 and is currently estimated at $380,805, approximately $197 per square foot. 50 Main St is a home located in Middlesex County with nearby schools including Valley Regional High School.
Ownership History
Date
Name
Owned For
Owner Type
Purchase Details
Closed on
Nov 8, 2013
Sold by
Heredia Edgar and Heredia Guilda
Bought by
Heredia Edgar
Current Estimated Value
Purchase Details
Closed on
Jan 7, 2009
Sold by
Fhlmc
Bought by
Heredia Edgar and Heredia Guilda
Home Financials for this Owner
Home Financials are based on the most recent Mortgage that was taken out on this home.
Original Mortgage
$161,991
Interest Rate
5.99%
Purchase Details
Closed on
Nov 18, 1998
Sold by
Whitney Robert A and Moran Raymond J
Bought by
Fitzpatrick Valerie R
Create a Home Valuation Report for This Property
The Home Valuation Report is an in-depth analysis detailing your home's value as well as a comparison with similar homes in the area
Home Values in the Area
Average Home Value in this Area
Purchase History
| Date | Buyer | Sale Price | Title Company |
|---|---|---|---|
| Heredia Edgar | -- | -- | |
| Heredia Edgar | $151,250 | -- | |
| Fitzpatrick Valerie R | $102,500 | -- |
Source: Public Records
Mortgage History
| Date | Status | Borrower | Loan Amount |
|---|---|---|---|
| Previous Owner | Fitzpatrick Valerie R | $162,000 | |
| Previous Owner | Fitzpatrick Valerie R | $161,991 | |
| Previous Owner | Fitzpatrick Valerie R | $200,000 |
Source: Public Records
Tax History
| Year | Tax Paid | Tax Assessment Tax Assessment Total Assessment is a certain percentage of the fair market value that is determined by local assessors to be the total taxable value of land and additions on the property. | Land | Improvement |
|---|---|---|---|---|
| 2025 | $4,873 | $152,390 | $36,470 | $115,920 |
| 2024 | $4,782 | $152,390 | $36,470 | $115,920 |
| 2023 | $4,553 | $152,390 | $36,470 | $115,920 |
| 2022 | $4,416 | $152,390 | $36,470 | $115,920 |
| 2021 | $4,508 | $152,390 | $36,470 | $115,920 |
| 2020 | $4,129 | $137,690 | $36,470 | $101,220 |
| 2019 | $0 | $137,690 | $36,470 | $101,220 |
| 2018 | $49,206 | $137,690 | $36,470 | $101,220 |
| 2017 | $3,982 | $137,690 | $36,470 | $101,220 |
| 2016 | $3,791 | $137,690 | $36,470 | $101,220 |
| 2015 | $4,292 | $163,310 | $40,530 | $122,780 |
| 2014 | $4,226 | $163,310 | $40,530 | $122,780 |
Source: Public Records
Map
Nearby Homes
- 11 Winter Ave
- 87 Main St
- 92 Main St Unit 202
- 92 Main St Unit 206
- 92 Main St Unit 101
- 33 Castle Heights
- 8 Prospect Hill
- 62 River St
- 170 Main St
- 113 Union St Unit Z
- 209 Main St
- 79 Middlesex Ave
- 25 Union St
- 43 Bokum Rd
- 6 Pelton Hill Rd
- 1 Ferry Rd
- 11 Kings Hwy
- 26 Ferry Rd
- 134 Meadow Woods Rd
- 153 Ferry Rd
Your Personal Tour Guide
Ask me questions while you tour the home.