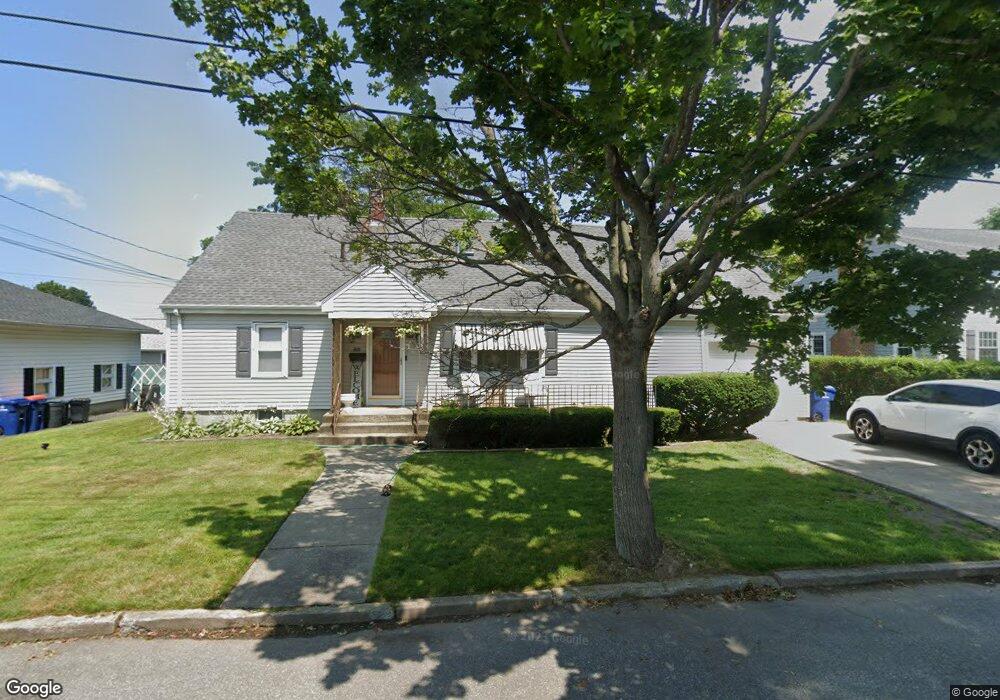
50 Mandell St New Bedford, MA 02740
The South End NeighborhoodEstimated Value: $483,000 - $675,000
5
Beds
2
Baths
2,292
Sq Ft
$256/Sq Ft
Est. Value
About This Home
This home is located at 50 Mandell St, New Bedford, MA 02740 and is currently estimated at $586,219, approximately $255 per square foot. 50 Mandell St is a home located in Bristol County with nearby schools including Betsey B. Winslow Elementary School, Keith Middle School, and New Bedford High School.
Ownership History
Date
Name
Owned For
Owner Type
Purchase Details
Closed on
Aug 18, 2009
Sold by
Macedo Kenneth and Macedo Robert D
Bought by
Macedo Robert D
Current Estimated Value
Purchase Details
Closed on
Jan 30, 2007
Sold by
Macedo Charleen and Macedo Kenneth D
Bought by
Macedo Kenneth
Purchase Details
Closed on
Dec 10, 1998
Sold by
Tavares Elizabeth A
Bought by
Macedo Robert D and Macedo Kenneth D
Create a Home Valuation Report for This Property
The Home Valuation Report is an in-depth analysis detailing your home's value as well as a comparison with similar homes in the area
Home Values in the Area
Average Home Value in this Area
Purchase History
| Date | Buyer | Sale Price | Title Company |
|---|---|---|---|
| Macedo Robert D | -- | -- | |
| Macedo Robert D | -- | -- | |
| Macedo Kenneth | -- | -- | |
| Macedo Kenneth | -- | -- | |
| Macedo Robert D | $132,500 | -- | |
| Macedo Robert D | $132,500 | -- |
Source: Public Records
Mortgage History
| Date | Status | Borrower | Loan Amount |
|---|---|---|---|
| Open | Macedo Robert D | $143,000 |
Source: Public Records
Tax History Compared to Growth
Tax History
| Year | Tax Paid | Tax Assessment Tax Assessment Total Assessment is a certain percentage of the fair market value that is determined by local assessors to be the total taxable value of land and additions on the property. | Land | Improvement |
|---|---|---|---|---|
| 2025 | $5,817 | $514,300 | $116,000 | $398,300 |
| 2024 | $5,282 | $440,200 | $118,000 | $322,200 |
| 2023 | $5,083 | $355,700 | $101,700 | $254,000 |
| 2022 | $4,709 | $303,000 | $96,700 | $206,300 |
| 2021 | $4,724 | $303,000 | $96,700 | $206,300 |
| 2020 | $4,551 | $281,600 | $96,700 | $184,900 |
| 2019 | $4,455 | $270,500 | $96,700 | $173,800 |
| 2018 | $4,156 | $249,900 | $96,700 | $153,200 |
| 2017 | $3,779 | $226,400 | $96,700 | $129,700 |
| 2016 | $3,641 | $220,800 | $96,700 | $124,100 |
| 2015 | $3,410 | $216,800 | $96,700 | $120,100 |
| 2014 | $3,208 | $211,600 | $90,900 | $120,700 |
Source: Public Records
Map
Nearby Homes