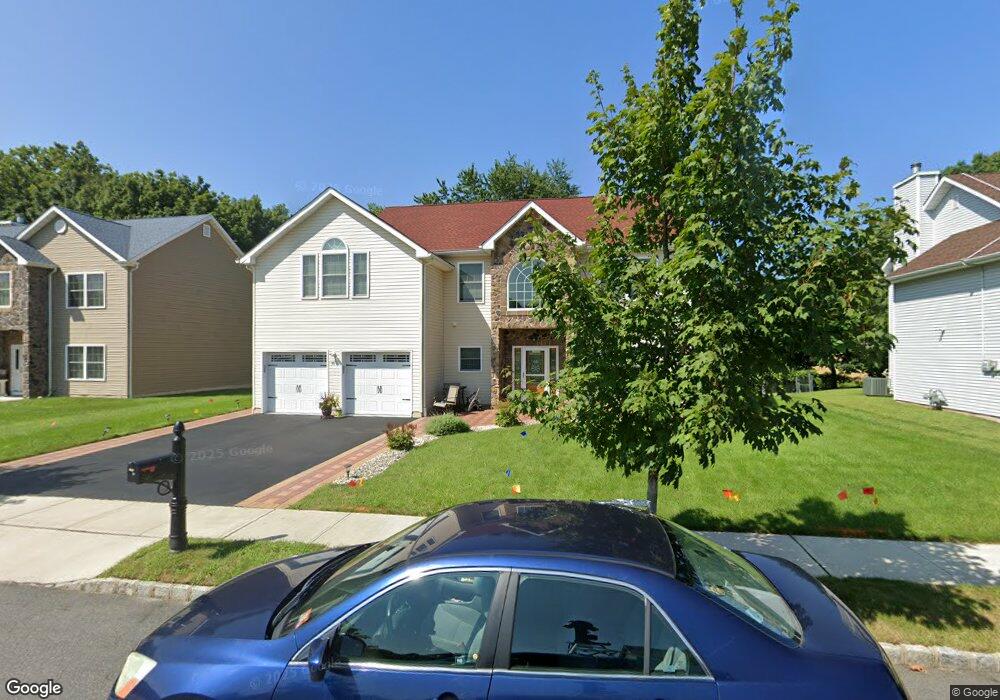
50 Marcel Ln Piscataway, NJ 08854
Estimated Value: $855,140 - $896,000
4
Beds
3
Baths
2,379
Sq Ft
$370/Sq Ft
Est. Value
About This Home
This home is located at 50 Marcel Ln, Piscataway, NJ 08854 and is currently estimated at $879,785, approximately $369 per square foot. 50 Marcel Ln is a home located in Middlesex County with nearby schools including Arbor Intermediate School, Dwight D. Eisenhower School, and Quibbletown Middle School.
Ownership History
Date
Name
Owned For
Owner Type
Purchase Details
Closed on
Aug 15, 2013
Sold by
Dacc Property Llc
Bought by
Shah Mukund C and Shah Rita M
Current Estimated Value
Home Financials for this Owner
Home Financials are based on the most recent Mortgage that was taken out on this home.
Original Mortgage
$180,000
Outstanding Balance
$44,711
Interest Rate
4.34%
Mortgage Type
New Conventional
Estimated Equity
$835,074
Create a Home Valuation Report for This Property
The Home Valuation Report is an in-depth analysis detailing your home's value as well as a comparison with similar homes in the area
Home Values in the Area
Average Home Value in this Area
Purchase History
| Date | Buyer | Sale Price | Title Company |
|---|---|---|---|
| Shah Mukund C | -- | None Available |
Source: Public Records
Mortgage History
| Date | Status | Borrower | Loan Amount |
|---|---|---|---|
| Open | Shah Mukund C | $180,000 |
Source: Public Records
Tax History Compared to Growth
Tax History
| Year | Tax Paid | Tax Assessment Tax Assessment Total Assessment is a certain percentage of the fair market value that is determined by local assessors to be the total taxable value of land and additions on the property. | Land | Improvement |
|---|---|---|---|---|
| 2025 | $13,567 | $728,200 | $333,900 | $394,300 |
| 2024 | $13,157 | $694,700 | $215,400 | $479,300 |
| 2023 | $13,157 | $629,500 | $215,400 | $414,100 |
| 2022 | $12,570 | $558,400 | $215,400 | $343,000 |
| 2021 | $12,235 | $522,400 | $215,400 | $307,000 |
| 2020 | $12,439 | $532,500 | $215,400 | $317,100 |
| 2019 | $12,663 | $532,500 | $215,400 | $317,100 |
| 2018 | $12,210 | $513,900 | $215,400 | $298,500 |
| 2017 | $12,260 | $445,800 | $220,400 | $225,400 |
| 2016 | $12,023 | $445,800 | $220,400 | $225,400 |
| 2015 | $11,858 | $445,800 | $220,400 | $225,400 |
| 2014 | $11,591 | $445,800 | $220,400 | $225,400 |
Source: Public Records
Map
Nearby Homes