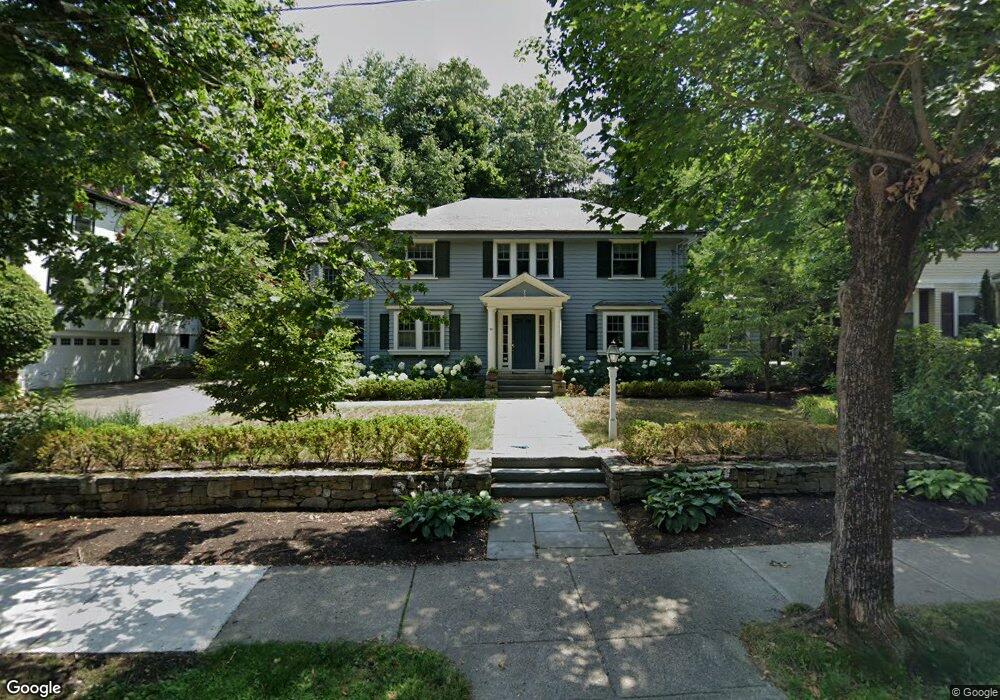
50 Marshall St Newton Center, MA 02459
Newton Centre NeighborhoodEstimated Value: $1,668,000 - $2,224,000
4
Beds
2
Baths
2,745
Sq Ft
$723/Sq Ft
Est. Value
About This Home
This home is located at 50 Marshall St, Newton Center, MA 02459 and is currently estimated at $1,984,075, approximately $722 per square foot. 50 Marshall St is a home located in Middlesex County with nearby schools including Ward Elementary School, Mason Rice Elementary School, and Charles E Brown Middle School.
Ownership History
Date
Name
Owned For
Owner Type
Purchase Details
Closed on
Nov 18, 1996
Sold by
Saroff Irma W
Bought by
Haley Peter and Haley Sara J
Current Estimated Value
Home Financials for this Owner
Home Financials are based on the most recent Mortgage that was taken out on this home.
Original Mortgage
$207,000
Interest Rate
7.99%
Mortgage Type
Purchase Money Mortgage
Create a Home Valuation Report for This Property
The Home Valuation Report is an in-depth analysis detailing your home's value as well as a comparison with similar homes in the area
Home Values in the Area
Average Home Value in this Area
Purchase History
| Date | Buyer | Sale Price | Title Company |
|---|---|---|---|
| Haley Peter | $445,000 | -- |
Source: Public Records
Mortgage History
| Date | Status | Borrower | Loan Amount |
|---|---|---|---|
| Open | Haley Peter | $250,000 | |
| Closed | Haley Peter | $207,000 | |
| Previous Owner | Haley Peter | $25,000 | |
| Previous Owner | Haley Peter | $50,000 |
Source: Public Records
Tax History Compared to Growth
Tax History
| Year | Tax Paid | Tax Assessment Tax Assessment Total Assessment is a certain percentage of the fair market value that is determined by local assessors to be the total taxable value of land and additions on the property. | Land | Improvement |
|---|---|---|---|---|
| 2025 | $16,141 | $1,647,000 | $1,285,100 | $361,900 |
| 2024 | $15,606 | $1,599,000 | $1,247,700 | $351,300 |
| 2023 | $14,524 | $1,426,700 | $960,300 | $466,400 |
| 2022 | $13,897 | $1,321,000 | $889,200 | $431,800 |
| 2021 | $5,653 | $1,246,200 | $838,900 | $407,300 |
| 2020 | $5,530 | $1,246,200 | $838,900 | $407,300 |
| 2019 | $12,643 | $1,209,900 | $814,500 | $395,400 |
| 2018 | $12,010 | $1,110,000 | $732,400 | $377,600 |
| 2017 | $4,738 | $1,047,200 | $690,900 | $356,300 |
| 2016 | $11,138 | $978,700 | $645,700 | $333,000 |
| 2015 | $10,620 | $914,700 | $603,500 | $311,200 |
Source: Public Records
Map
Nearby Homes
- 44 Irving St
- 1004 Centre St
- 173-175 Warren St
- 21 Francis St Unit 21A
- 23 Francis St Unit 23-1
- 92 Grant Ave
- 145 Warren St Unit 4
- 9 The Ledges Rd
- 9 Ripley St Unit 1
- 154 Langley Rd Unit 1
- 73 Elmore St
- Lot 3 Chapin Rd
- Lot 2 Chapin Rd
- Lots 2 & 3 Chapin Rd
- 31 W Boulevard Rd
- 20 Bartlett Terrace
- 9 Laurel St
- 0,351&335 Langley Rd
- 3 Cedar St
- 59 Charlotte Rd
