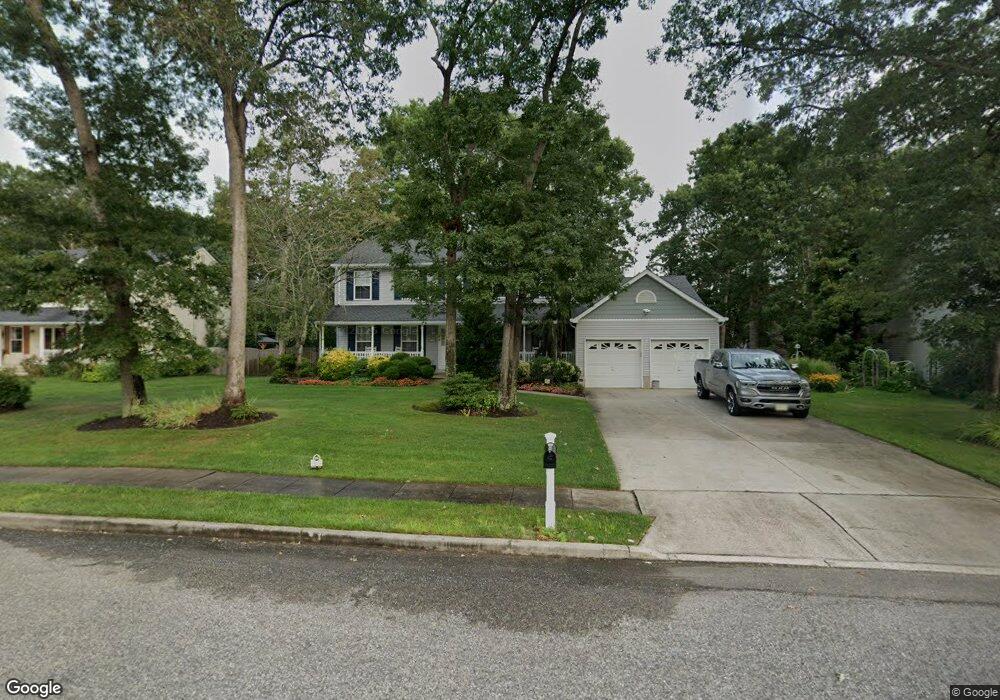
50 Maxim Dr Forked River, NJ 08731
Estimated Value: $626,507 - $726,000
4
Beds
3
Baths
3,532
Sq Ft
$189/Sq Ft
Est. Value
About This Home
This home is located at 50 Maxim Dr, Forked River, NJ 08731 and is currently estimated at $665,877, approximately $188 per square foot. 50 Maxim Dr is a home located in Ocean County with nearby schools including Lacey Township High School.
Ownership History
Date
Name
Owned For
Owner Type
Purchase Details
Closed on
Jul 26, 2006
Sold by
Vannorman Robert G and Van Norman Doris J
Bought by
Vannorman Doris J
Current Estimated Value
Purchase Details
Closed on
Oct 17, 1995
Sold by
Charles Kennis Inc
Bought by
Vannorman Robert and Van Norman Doris
Home Financials for this Owner
Home Financials are based on the most recent Mortgage that was taken out on this home.
Original Mortgage
$65,000
Outstanding Balance
$456
Interest Rate
7.6%
Estimated Equity
$665,421
Create a Home Valuation Report for This Property
The Home Valuation Report is an in-depth analysis detailing your home's value as well as a comparison with similar homes in the area
Home Values in the Area
Average Home Value in this Area
Purchase History
| Date | Buyer | Sale Price | Title Company |
|---|---|---|---|
| Vannorman Doris J | -- | None Available | |
| Vannorman Robert | $178,000 | -- |
Source: Public Records
Mortgage History
| Date | Status | Borrower | Loan Amount |
|---|---|---|---|
| Open | Vannorman Robert | $65,000 |
Source: Public Records
Tax History
| Year | Tax Paid | Tax Assessment Tax Assessment Total Assessment is a certain percentage of the fair market value that is determined by local assessors to be the total taxable value of land and additions on the property. | Land | Improvement |
|---|---|---|---|---|
| 2025 | $9,604 | $379,000 | $123,500 | $255,500 |
| 2024 | $8,979 | $379,000 | $123,500 | $255,500 |
| 2023 | $8,577 | $379,000 | $123,500 | $255,500 |
| 2022 | $8,577 | $379,000 | $123,500 | $255,500 |
| 2021 | $8,433 | $379,000 | $123,500 | $255,500 |
| 2020 | $8,164 | $379,000 | $123,500 | $255,500 |
| 2019 | $8,020 | $379,000 | $123,500 | $255,500 |
| 2018 | $7,925 | $379,000 | $123,500 | $255,500 |
| 2017 | $7,743 | $379,000 | $123,500 | $255,500 |
| 2016 | $7,713 | $379,000 | $123,500 | $255,500 |
| 2015 | $7,368 | $379,000 | $123,500 | $255,500 |
| 2014 | $6,643 | $386,200 | $133,500 | $252,700 |
Source: Public Records
Map
Nearby Homes
- 650 Chelsea St
- 534 Holmes Ave N
- 653 Elwood St
- 1030 Elwood St
- 504 Devoe Ave
- 805 Maria Loretta Ln
- 510 Oak Hill Ct
- 112 Brick Ave
- 0 Bell St Unit NJOC2038820
- 0 Bell St Unit 22536923
- 000 Elwood St
- 932 Elwood St
- 576 Vaughn Ave
- 741 Oxford Rd
- 11 Bell St
- 923 Tappan St
- 930 Tappan St
- 1013 Chelsea St
- 201 Manchester Ave
- 1007 Elwood St
- 0 Maxim Dr Unit 21510889
- 0 Maxim Dr Unit NJOC137586
- 0 Maxim Dr
- 52 Maxim Dr
- 48 Maxim Dr
- 46 Maxim Dr
- 54 Maxim Dr
- 51 Maxim Dr
- 49 Maxim Dr
- 0 Grove St Unit 22039420
- 0 Grove St
- 47 Manchester Ave
- 47 Maxim Dr
- 55 Maxim Dr
- 43 Manchester Ave
- 53 Manchester Ave
- 722 Maxim Dr
- 56 Maxim Dr
- 37 Manchester Ave
- 720 Maxim Dr
Your Personal Tour Guide
Ask me questions while you tour the home.