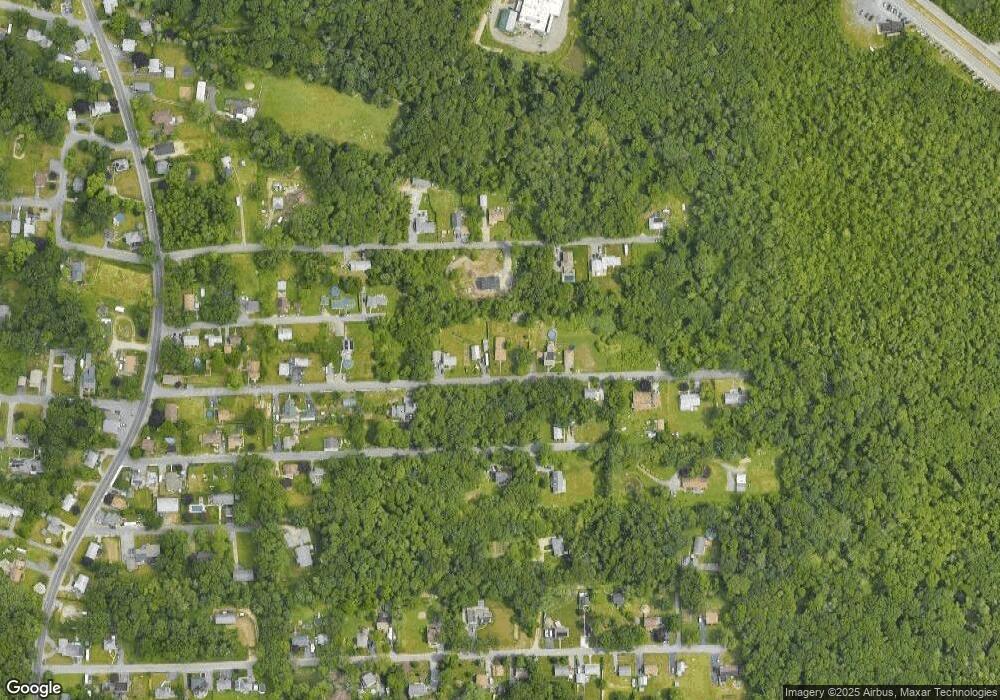
50 Milk Ave Westport, MA 02790
North Westport NeighborhoodEstimated Value: $429,000 - $515,000
4
Beds
2
Baths
1,620
Sq Ft
$294/Sq Ft
Est. Value
About This Home
This home is located at 50 Milk Ave, Westport, MA 02790 and is currently estimated at $476,582, approximately $294 per square foot. 50 Milk Ave is a home located in Bristol County with nearby schools including Alice A. Macomber Primary School, Westport Elementary School, and Westport Middle-High School.
Ownership History
Date
Name
Owned For
Owner Type
Purchase Details
Closed on
Sep 30, 1993
Sold by
Sullivan Wayne and Sullivan Veronica
Bought by
Cacilhas Dinis and Cacilhas Ana
Current Estimated Value
Purchase Details
Closed on
Dec 26, 1989
Sold by
Mccarthy Norman
Bought by
Sullivan Wayne
Create a Home Valuation Report for This Property
The Home Valuation Report is an in-depth analysis detailing your home's value as well as a comparison with similar homes in the area
Home Values in the Area
Average Home Value in this Area
Purchase History
| Date | Buyer | Sale Price | Title Company |
|---|---|---|---|
| Cacilhas Dinis | $75,000 | -- | |
| Sullivan Wayne | $87,000 | -- |
Source: Public Records
Mortgage History
| Date | Status | Borrower | Loan Amount |
|---|---|---|---|
| Open | Sullivan Wayne | $87,000 | |
| Closed | Sullivan Wayne | $30,000 | |
| Closed | Sullivan Wayne | $40,000 |
Source: Public Records
Tax History Compared to Growth
Tax History
| Year | Tax Paid | Tax Assessment Tax Assessment Total Assessment is a certain percentage of the fair market value that is determined by local assessors to be the total taxable value of land and additions on the property. | Land | Improvement |
|---|---|---|---|---|
| 2025 | $2,742 | $368,000 | $146,200 | $221,800 |
| 2024 | $2,502 | $323,700 | $135,400 | $188,300 |
| 2023 | $2,379 | $291,500 | $122,800 | $168,700 |
| 2022 | $2,206 | $260,200 | $116,700 | $143,500 |
| 2021 | $4,457 | $249,600 | $106,100 | $143,500 |
| 2020 | $2,023 | $240,000 | $96,500 | $143,500 |
| 2019 | $1,543 | $239,700 | $96,500 | $143,200 |
| 2018 | $3,837 | $177,400 | $84,200 | $93,200 |
| 2017 | $4,091 | $176,600 | $90,000 | $86,600 |
| 2016 | $1,376 | $174,000 | $85,400 | $88,600 |
| 2015 | $1,347 | $169,800 | $98,100 | $71,700 |
Source: Public Records
Map
Nearby Homes