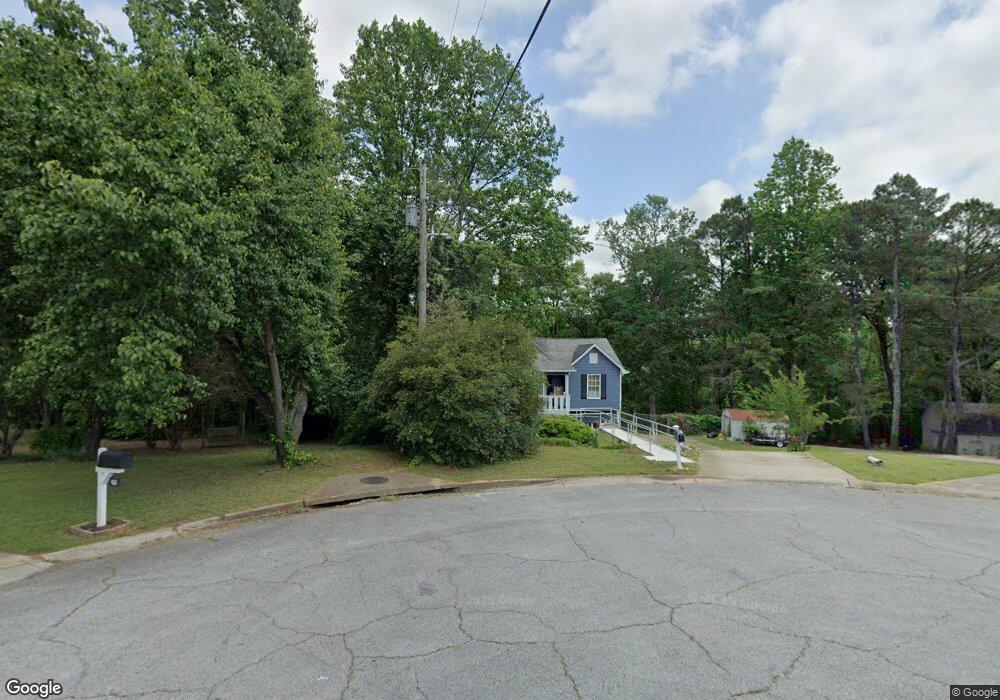
50 Mill Hollow Rd Carrollton, GA 30116
Estimated Value: $242,212 - $259,000
3
Beds
3
Baths
1,192
Sq Ft
$211/Sq Ft
Est. Value
About This Home
This home is located at 50 Mill Hollow Rd, Carrollton, GA 30116 and is currently estimated at $252,053, approximately $211 per square foot. 50 Mill Hollow Rd is a home located in Carroll County with nearby schools including Central Elementary School, Central Middle School, and Central High School.
Ownership History
Date
Name
Owned For
Owner Type
Purchase Details
Closed on
Apr 30, 2007
Sold by
Sec Of Housing Urban
Bought by
Williams I Arlene
Current Estimated Value
Home Financials for this Owner
Home Financials are based on the most recent Mortgage that was taken out on this home.
Original Mortgage
$87,000
Outstanding Balance
$52,746
Interest Rate
6.11%
Mortgage Type
New Conventional
Estimated Equity
$199,307
Purchase Details
Closed on
Oct 3, 2006
Sold by
Not Provided
Bought by
Williams I Arlene and Williams Joseph K
Purchase Details
Closed on
Nov 9, 2001
Sold by
Summey Scott W
Bought by
Summey Scott W and Summey Kel
Purchase Details
Closed on
Jan 29, 2001
Sold by
Patterson Mike and Patterson Peg
Bought by
Summey Scott W
Purchase Details
Closed on
Dec 29, 2000
Sold by
Household Realty Cor
Bought by
Patterson Mike and Patterson Peg
Purchase Details
Closed on
Oct 3, 2000
Sold by
Phillips Jerrold L
Bought by
Household Realty Cor
Purchase Details
Closed on
Jul 22, 1997
Sold by
Landon
Bought by
Phillips Jerrold L
Create a Home Valuation Report for This Property
The Home Valuation Report is an in-depth analysis detailing your home's value as well as a comparison with similar homes in the area
Home Values in the Area
Average Home Value in this Area
Purchase History
| Date | Buyer | Sale Price | Title Company |
|---|---|---|---|
| Williams I Arlene | -- | -- | |
| Williams I Arlene | $108,363 | -- | |
| Williams I Arlene | $108,363 | -- | |
| Summey Scott W | -- | -- | |
| Summey Scott W | $104,900 | -- | |
| Patterson Mike | $75,000 | -- | |
| Household Realty Cor | $85,000 | -- | |
| Phillips Jerrold L | $82,900 | -- |
Source: Public Records
Mortgage History
| Date | Status | Borrower | Loan Amount |
|---|---|---|---|
| Open | Williams I Arlene | $87,000 |
Source: Public Records
Tax History Compared to Growth
Tax History
| Year | Tax Paid | Tax Assessment Tax Assessment Total Assessment is a certain percentage of the fair market value that is determined by local assessors to be the total taxable value of land and additions on the property. | Land | Improvement |
|---|---|---|---|---|
| 2024 | $1,582 | $89,184 | $8,000 | $81,184 |
| 2023 | $1,582 | $81,943 | $8,000 | $73,943 |
| 2022 | $1,344 | $67,389 | $8,000 | $59,389 |
| 2021 | $1,227 | $59,008 | $8,000 | $51,008 |
| 2020 | $1,120 | $53,019 | $8,000 | $45,019 |
| 2019 | $1,080 | $50,451 | $8,000 | $42,451 |
| 2018 | $996 | $45,137 | $8,000 | $37,137 |
| 2017 | $992 | $44,737 | $8,000 | $36,737 |
| 2016 | $992 | $44,737 | $8,000 | $36,737 |
| 2015 | $858 | $34,662 | $6,000 | $28,663 |
| 2014 | $861 | $34,663 | $6,000 | $28,663 |
Source: Public Records
Map
Nearby Homes
- 42 Mill Hollow
- 42 Mill Hollow Rd
- 47 Mill Hollow Road 0
- 47 Mill Hollow
- 47 Mill Hollow Rd
- 0 Mill Hollow Rd 0
- 28 Mill Hollow Rd
- 35 Mill Hollow Rd
- 40 Mill Trace
- 32 Mill Trace
- 12 Mill Hollow Rd
- 23 Mill Hollow Rd
- 22 Mill Trace
- 15 Mill Hollow
- 0 Mill Trace Unit 8784585
- 0 Mill Trace Unit 3210052
- 0 Mill Trace Unit 8926184
- 0 Mill Trace
- 15 Mill Hollow Rd
- 114 Mill Trace