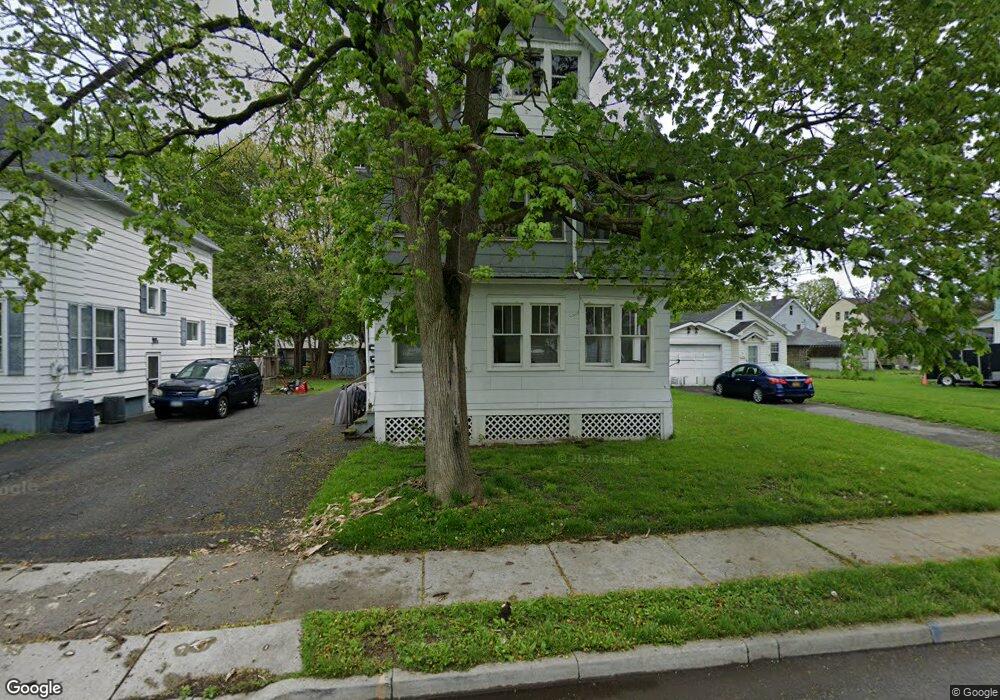
50 Moeller St Binghamton, NY 13904
Eastside Binghamton NeighborhoodEstimated Value: $110,510 - $191,000
3
Beds
3
Baths
1,200
Sq Ft
$136/Sq Ft
Est. Value
About This Home
This home is located at 50 Moeller St, Binghamton, NY 13904 and is currently estimated at $162,878, approximately $135 per square foot. 50 Moeller St is a home located in Broome County with nearby schools including Calvin Coolidge Elementary School, Binghamton High School, and East Middle School.
Ownership History
Date
Name
Owned For
Owner Type
Purchase Details
Closed on
Nov 18, 2022
Sold by
Curry Christopher M
Bought by
Shade B3 Llc
Current Estimated Value
Purchase Details
Closed on
Dec 7, 2005
Sold by
Lazarevic Sasa
Bought by
Pfeiffer Renee
Home Financials for this Owner
Home Financials are based on the most recent Mortgage that was taken out on this home.
Original Mortgage
$78,300
Interest Rate
6.36%
Mortgage Type
New Conventional
Purchase Details
Closed on
Sep 20, 2002
Sold by
Pierson David S and Pierson Diane M
Bought by
Lazarevic Sasa
Create a Home Valuation Report for This Property
The Home Valuation Report is an in-depth analysis detailing your home's value as well as a comparison with similar homes in the area
Home Values in the Area
Average Home Value in this Area
Purchase History
| Date | Buyer | Sale Price | Title Company |
|---|---|---|---|
| Shade B3 Llc | $125,000 | -- | |
| Pfeiffer Renee | $87,000 | Peter Gordon | |
| Lazarevic Sasa | $45,500 | Lori Grumet Schapiro |
Source: Public Records
Mortgage History
| Date | Status | Borrower | Loan Amount |
|---|---|---|---|
| Previous Owner | Pfeiffer Renee | $78,300 |
Source: Public Records
Tax History Compared to Growth
Tax History
| Year | Tax Paid | Tax Assessment Tax Assessment Total Assessment is a certain percentage of the fair market value that is determined by local assessors to be the total taxable value of land and additions on the property. | Land | Improvement |
|---|---|---|---|---|
| 2024 | $7,293 | $74,000 | $4,500 | $69,500 |
| 2023 | $7,160 | $74,000 | $4,500 | $69,500 |
| 2022 | $6,992 | $74,000 | $4,500 | $69,500 |
| 2021 | $6,913 | $74,000 | $4,500 | $69,500 |
| 2020 | $4,572 | $74,000 | $4,500 | $69,500 |
| 2019 | $2,333 | $74,000 | $4,500 | $69,500 |
| 2018 | $4,458 | $74,000 | $4,500 | $69,500 |
| 2017 | $4,480 | $74,000 | $4,500 | $69,500 |
| 2016 | $4,498 | $74,000 | $4,500 | $69,500 |
| 2015 | $3,997 | $74,000 | $4,500 | $69,500 |
| 2014 | $3,997 | $74,000 | $4,500 | $69,500 |
Source: Public Records
Map
Nearby Homes