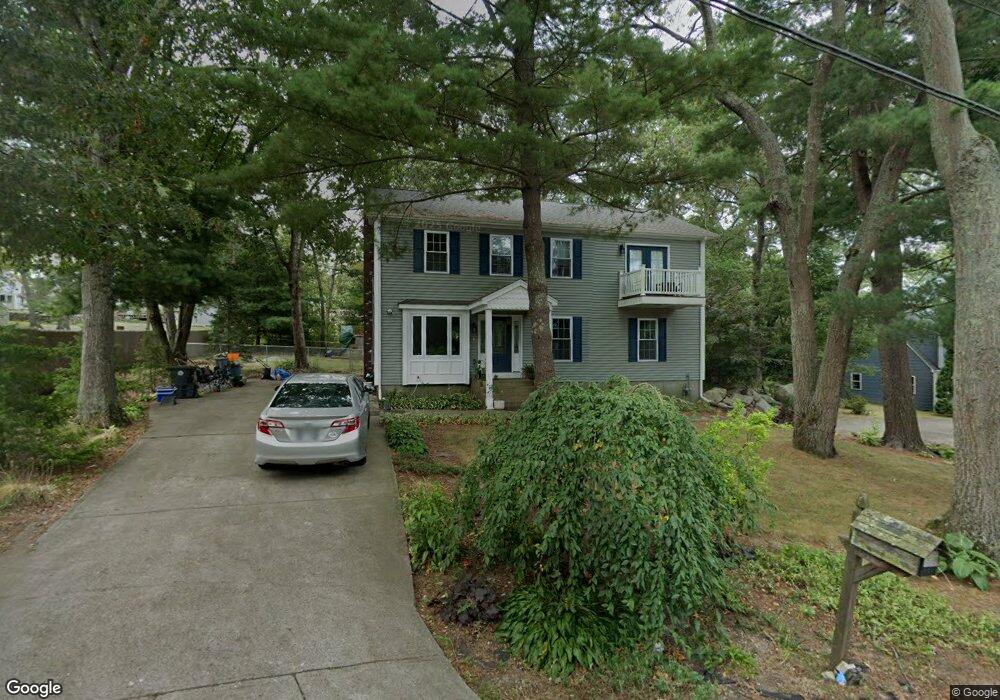
50 Mohawk St Coventry, RI 02816
Estimated Value: $432,000 - $526,000
3
Beds
2
Baths
1,592
Sq Ft
$312/Sq Ft
Est. Value
About This Home
This home is located at 50 Mohawk St, Coventry, RI 02816 and is currently estimated at $496,383, approximately $311 per square foot. 50 Mohawk St is a home located in Kent County with nearby schools including Alan Shawn Feinstein Ms Of Cov, Coventry High School, and Father John V. Doyle School.
Ownership History
Date
Name
Owned For
Owner Type
Purchase Details
Closed on
Sep 11, 2019
Sold by
Ross-Coke Leah D
Bought by
Ross-Coke Leah D and Kuzman Kenneth K
Current Estimated Value
Purchase Details
Closed on
Apr 12, 2000
Sold by
Holland Thomas A and Holland Gail A
Bought by
Lafreniere Robin
Purchase Details
Closed on
Oct 11, 1988
Sold by
Roach Kenneth T
Bought by
Holland Thomas A
Create a Home Valuation Report for This Property
The Home Valuation Report is an in-depth analysis detailing your home's value as well as a comparison with similar homes in the area
Purchase History
| Date | Buyer | Sale Price | Title Company |
|---|---|---|---|
| Ross-Coke Leah D | -- | -- | |
| Lafreniere Robin | $120,000 | -- | |
| Holland Thomas A | $112,000 | -- |
Source: Public Records
Mortgage History
| Date | Status | Borrower | Loan Amount |
|---|---|---|---|
| Previous Owner | Holland Thomas A | $203,500 | |
| Previous Owner | Holland Thomas A | $56,000 | |
| Previous Owner | Holland Thomas A | $141,000 |
Source: Public Records
Tax History
| Year | Tax Paid | Tax Assessment Tax Assessment Total Assessment is a certain percentage of the fair market value that is determined by local assessors to be the total taxable value of land and additions on the property. | Land | Improvement |
|---|---|---|---|---|
| 2025 | $6,068 | $377,100 | $129,100 | $248,000 |
| 2024 | $6,026 | $380,400 | $129,100 | $251,300 |
| 2023 | $5,832 | $380,400 | $129,100 | $251,300 |
| 2022 | $5,988 | $306,000 | $122,400 | $183,600 |
| 2021 | $5,936 | $306,000 | $122,400 | $183,600 |
| 2020 | $6,805 | $306,000 | $122,400 | $183,600 |
| 2019 | $4,343 | $195,300 | $96,600 | $98,700 |
| 2018 | $4,220 | $195,300 | $96,600 | $98,700 |
| 2017 | $4,097 | $195,300 | $96,600 | $98,700 |
| 2016 | $3,565 | $166,500 | $77,400 | $89,100 |
| 2015 | $3,468 | $166,500 | $77,400 | $89,100 |
| 2014 | $3,396 | $166,500 | $77,400 | $89,100 |
| 2013 | $3,372 | $180,700 | $76,700 | $104,000 |
Source: Public Records
Map
Nearby Homes
- 39 Mohawk St
- 27 Mead St
- 22 Rawlinson Dr
- 21 Darton St
- 55 Columbia Ave
- 275 E Shore Dr
- 251 E Shore Dr
- 1 Pettine St
- 11 Kennedy Dr
- 22 Colorado St
- 21 Florida Ave
- 6 Field Ave
- 45 Pine Ave Unit 36
- 10 Colonial Rd
- 57 Twin Lakes Ave
- 91 Windsor Park Dr
- 9 Holmes Rd
- 0 New London Turnpike
- 27 Matteson St
- 19 Turner Dr
Your Personal Tour Guide
Ask me questions while you tour the home.