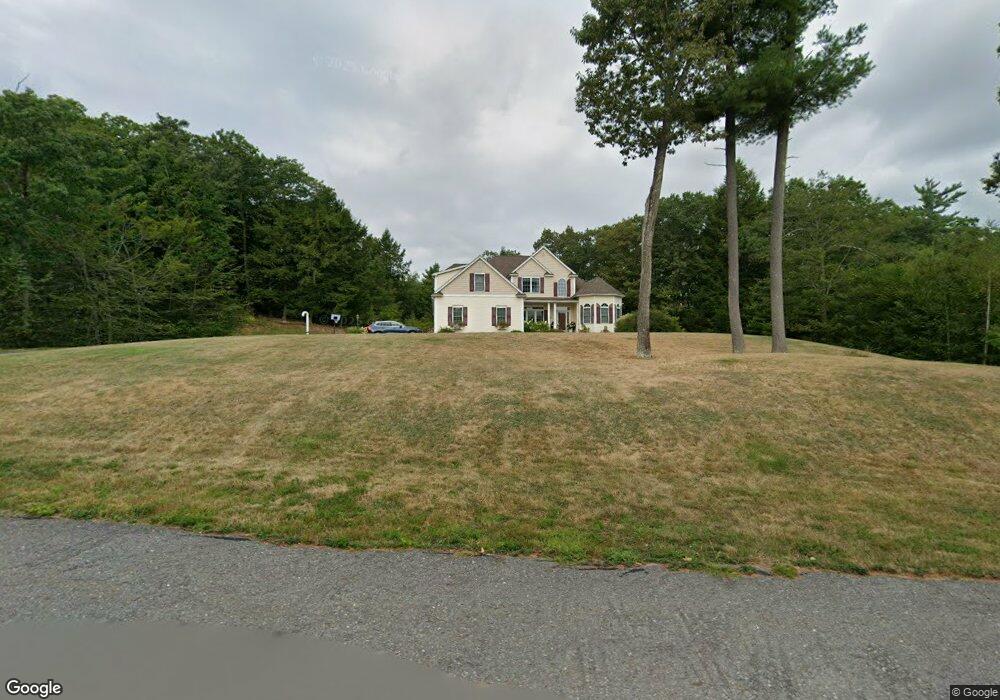
50 Moore Rd Ashburnham, MA 01430
Estimated Value: $622,000 - $942,000
3
Beds
3
Baths
1,800
Sq Ft
$439/Sq Ft
Est. Value
About This Home
This home is located at 50 Moore Rd, Ashburnham, MA 01430 and is currently estimated at $790,777, approximately $439 per square foot. 50 Moore Rd is a home located in Worcester County with nearby schools including Oakmont Regional High School and Cushing Academy.
Ownership History
Date
Name
Owned For
Owner Type
Purchase Details
Closed on
May 26, 2017
Sold by
Bourekas Gregory S and Bourekas Joanne M
Bought by
Devlin Jeremy C and Devlin Rebecca J
Current Estimated Value
Home Financials for this Owner
Home Financials are based on the most recent Mortgage that was taken out on this home.
Original Mortgage
$218,000
Outstanding Balance
$180,760
Interest Rate
4.08%
Mortgage Type
New Conventional
Estimated Equity
$610,017
Purchase Details
Closed on
Aug 29, 2008
Sold by
Bne Realty & Dev Llc
Bought by
Bourekas Gregory S and Bourekas Joanne M
Home Financials for this Owner
Home Financials are based on the most recent Mortgage that was taken out on this home.
Original Mortgage
$260,000
Interest Rate
6.29%
Mortgage Type
Purchase Money Mortgage
Create a Home Valuation Report for This Property
The Home Valuation Report is an in-depth analysis detailing your home's value as well as a comparison with similar homes in the area
Home Values in the Area
Average Home Value in this Area
Purchase History
| Date | Buyer | Sale Price | Title Company |
|---|---|---|---|
| Devlin Jeremy C | $410,000 | -- | |
| Devlin Jeremy C | $410,000 | -- | |
| Bourekas Gregory S | $445,715 | -- | |
| Bourekas Gregory S | $445,715 | -- |
Source: Public Records
Mortgage History
| Date | Status | Borrower | Loan Amount |
|---|---|---|---|
| Open | Devlin Jeremy C | $218,000 | |
| Closed | Devlin Jeremy C | $218,000 | |
| Previous Owner | Bourekas Gregory S | $75,000 | |
| Previous Owner | Bourekas Gregory S | $260,000 |
Source: Public Records
Tax History
| Year | Tax Paid | Tax Assessment Tax Assessment Total Assessment is a certain percentage of the fair market value that is determined by local assessors to be the total taxable value of land and additions on the property. | Land | Improvement |
|---|---|---|---|---|
| 2025 | $12,187 | $819,600 | $49,800 | $769,800 |
| 2024 | $11,798 | $749,100 | $49,800 | $699,300 |
| 2023 | $11,067 | $668,700 | $49,800 | $618,900 |
| 2022 | $10,207 | $540,600 | $46,200 | $494,400 |
| 2021 | $9,254 | $450,300 | $46,200 | $404,100 |
| 2020 | $9,051 | $450,300 | $46,200 | $404,100 |
| 2019 | $9,552 | $423,600 | $46,200 | $377,400 |
| 2018 | $9,662 | $412,900 | $43,800 | $369,100 |
| 2017 | $3,901 | $406,100 | $40,800 | $365,300 |
| 2016 | $9,011 | $396,100 | $40,200 | $355,900 |
| 2015 | $8,825 | $396,100 | $40,200 | $355,900 |
Source: Public Records
Map
Nearby Homes
- 152 Ashby Rd
- 0 Rindge Turnpike
- 57 Ashby Rd
- 151 Wilker Rd
- 44 Rindge State Rd
- 2409 W State Rd
- Lot 3 W State Rd
- 26 Wellington Rd
- 100 Main St
- 14 Central St
- 72 Park Rd
- 9 Willard Rd
- 18 Corey Hill Rd
- 75 Willard Rd
- 36 Hillandale Rd
- Lot 40C Winchendon Rd
- 6 Wyman Rd
- 137 Deer Bay Rd
- 544 South Rd
- 162 Sherbert Rd
Your Personal Tour Guide
Ask me questions while you tour the home.