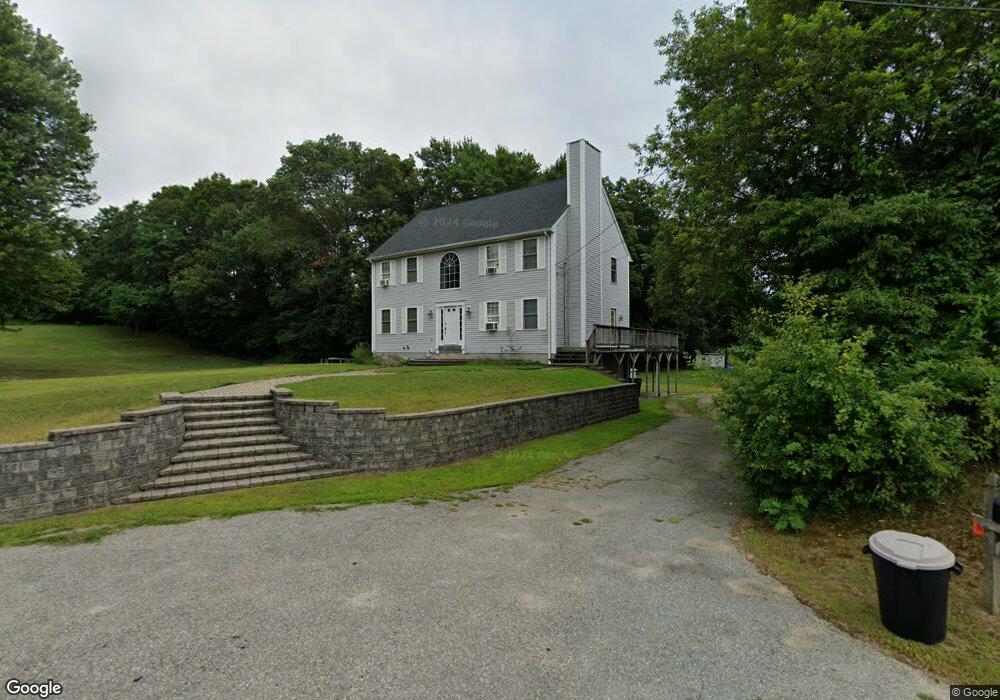
50 Morse Ave Attleboro, MA 02703
Estimated Value: $639,575 - $778,000
3
Beds
3
Baths
2,240
Sq Ft
$314/Sq Ft
Est. Value
About This Home
This home is located at 50 Morse Ave, Attleboro, MA 02703 and is currently estimated at $703,144, approximately $313 per square foot. 50 Morse Ave is a home located in Bristol County with nearby schools including Hill-Roberts Elementary School, Robert J. Coelho Middle School, and Attleboro High School.
Ownership History
Date
Name
Owned For
Owner Type
Purchase Details
Closed on
Sep 14, 2015
Sold by
Rubyck Joelle M and Rybyck Scott P
Bought by
Rybyck Scott P
Current Estimated Value
Home Financials for this Owner
Home Financials are based on the most recent Mortgage that was taken out on this home.
Original Mortgage
$267,000
Outstanding Balance
$210,424
Interest Rate
4.01%
Mortgage Type
New Conventional
Estimated Equity
$492,720
Purchase Details
Closed on
Jan 17, 2007
Sold by
Rubyck Scott P
Bought by
Rubyck Scott P and Rubyck Joelle M
Purchase Details
Closed on
Jan 3, 1997
Sold by
Simons Alden J and Simons Alden
Bought by
Rubyck Scott P and Rubyck Andrea L
Home Financials for this Owner
Home Financials are based on the most recent Mortgage that was taken out on this home.
Original Mortgage
$167,800
Interest Rate
7.48%
Mortgage Type
Purchase Money Mortgage
Create a Home Valuation Report for This Property
The Home Valuation Report is an in-depth analysis detailing your home's value as well as a comparison with similar homes in the area
Home Values in the Area
Average Home Value in this Area
Purchase History
| Date | Buyer | Sale Price | Title Company |
|---|---|---|---|
| Rybyck Scott P | -- | -- | |
| Rubyck Scott P | -- | -- | |
| Rubyck Scott P | $186,500 | -- |
Source: Public Records
Mortgage History
| Date | Status | Borrower | Loan Amount |
|---|---|---|---|
| Open | Rybyck Scott P | $267,000 | |
| Previous Owner | Rubyck Scott P | $288,000 | |
| Previous Owner | Rubyck Scott P | $167,800 | |
| Previous Owner | Rubyck Scott P | $35,000 |
Source: Public Records
Tax History
| Year | Tax Paid | Tax Assessment Tax Assessment Total Assessment is a certain percentage of the fair market value that is determined by local assessors to be the total taxable value of land and additions on the property. | Land | Improvement |
|---|---|---|---|---|
| 2025 | $6,791 | $541,100 | $188,500 | $352,600 |
| 2024 | $6,420 | $504,300 | $171,100 | $333,200 |
| 2023 | $6,095 | $445,200 | $172,700 | $272,500 |
| 2022 | $5,871 | $406,300 | $165,300 | $241,000 |
| 2021 | $5,850 | $395,300 | $159,500 | $235,800 |
| 2020 | $5,579 | $383,200 | $152,900 | $230,300 |
| 2019 | $5,432 | $383,600 | $150,300 | $233,300 |
| 2018 | $5,283 | $356,500 | $146,300 | $210,200 |
| 2017 | $5,142 | $353,400 | $142,900 | $210,500 |
| 2016 | $4,994 | $337,000 | $135,000 | $202,000 |
| 2015 | $4,860 | $330,400 | $135,000 | $195,400 |
| 2014 | $4,785 | $322,200 | $129,100 | $193,100 |
Source: Public Records
Map
Nearby Homes
Your Personal Tour Guide
Ask me questions while you tour the home.