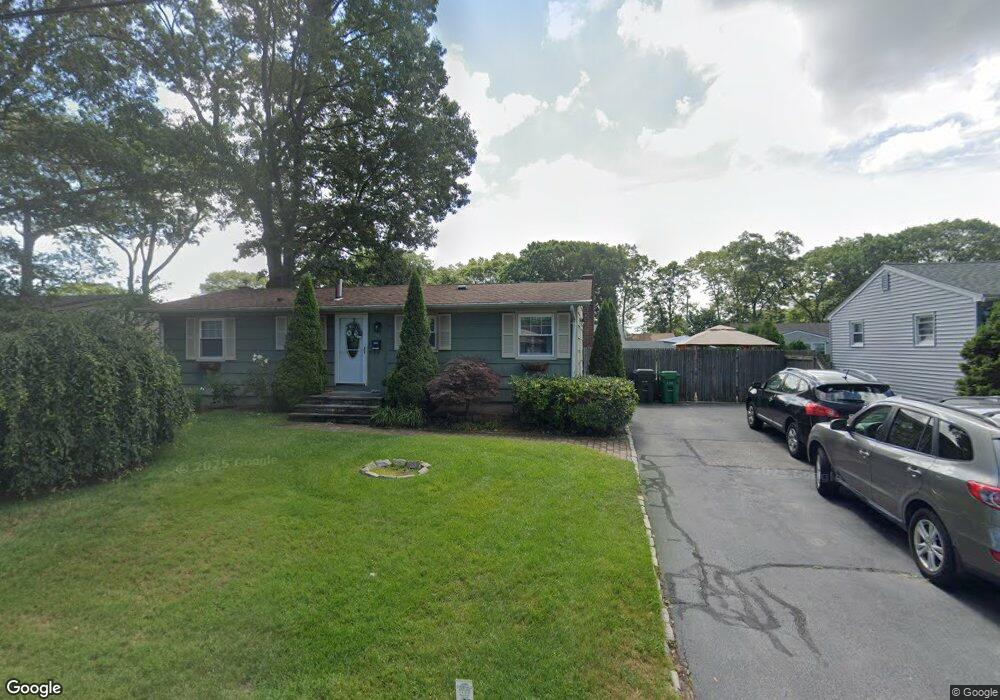
50 Morse Ave Warwick, RI 02886
Greenwood NeighborhoodEstimated Value: $360,000 - $452,000
3
Beds
1
Bath
1,608
Sq Ft
$254/Sq Ft
Est. Value
About This Home
This home is located at 50 Morse Ave, Warwick, RI 02886 and is currently estimated at $408,430, approximately $253 per square foot. 50 Morse Ave is a home located in Kent County with nearby schools including St Rose Of Lima School.
Ownership History
Date
Name
Owned For
Owner Type
Purchase Details
Closed on
May 19, 2010
Sold by
Silva Luis
Bought by
Silva Luis and Stafford Lisa
Current Estimated Value
Purchase Details
Closed on
Apr 7, 2010
Sold by
Carolan Victoria J and Cco Mortgage Corp
Bought by
Cco Mortgage Corp
Purchase Details
Closed on
Apr 28, 2006
Sold by
Odonald Timothy and Odonald Nyree
Bought by
Carolan Victoria J
Purchase Details
Closed on
Oct 28, 2002
Sold by
Lamarche Robert and Lamarche Paula
Bought by
Odonald Timothy
Create a Home Valuation Report for This Property
The Home Valuation Report is an in-depth analysis detailing your home's value as well as a comparison with similar homes in the area
Home Values in the Area
Average Home Value in this Area
Purchase History
| Date | Buyer | Sale Price | Title Company |
|---|---|---|---|
| Silva Luis | -- | -- | |
| Silva Luis | $130,000 | -- | |
| Cco Mortgage Corp | $234,750 | -- | |
| Carolan Victoria J | $242,000 | -- | |
| Odonald Timothy | $166,000 | -- |
Source: Public Records
Mortgage History
| Date | Status | Borrower | Loan Amount |
|---|---|---|---|
| Open | Odonald Timothy | $25,000 | |
| Open | Odonald Timothy | $93,000 |
Source: Public Records
Tax History Compared to Growth
Tax History
| Year | Tax Paid | Tax Assessment Tax Assessment Total Assessment is a certain percentage of the fair market value that is determined by local assessors to be the total taxable value of land and additions on the property. | Land | Improvement |
|---|---|---|---|---|
| 2025 | $4,939 | $388,900 | $105,100 | $283,800 |
| 2024 | $4,364 | $301,600 | $86,800 | $214,800 |
| 2023 | $4,280 | $301,600 | $86,800 | $214,800 |
| 2022 | $4,143 | $221,200 | $60,900 | $160,300 |
| 2021 | $4,143 | $221,200 | $60,900 | $160,300 |
| 2020 | $4,143 | $221,200 | $60,900 | $160,300 |
| 2019 | $4,143 | $221,200 | $60,900 | $160,300 |
| 2018 | $3,561 | $171,200 | $59,900 | $111,300 |
| 2017 | $3,465 | $171,200 | $59,900 | $111,300 |
| 2016 | $3,465 | $171,200 | $59,900 | $111,300 |
| 2015 | $3,056 | $147,300 | $56,700 | $90,600 |
| 2014 | $2,955 | $147,300 | $56,700 | $90,600 |
| 2013 | $2,915 | $147,300 | $56,700 | $90,600 |
Source: Public Records
Map
Nearby Homes
- 143 Morse Ave
- 224 Palace Ave
- 67 Ashwood Cir
- 6 Lillian Ct
- 74 Stephens Ave
- 106 Child Ln
- 2789 Post Rd
- 190 Chapmans Ave
- 62 Red Maple Ln
- 71 Red Maple Ln
- 38 Red Maple Ln
- 77 Buttonwoods Ave
- 69 Haverhill Ave
- 64 Ormsby Ave
- 333 Greenwood Ave
- 79 Carpenter St
- 3383 W Shore Rd
- 45 Tourtelot Ave
- 121 Hamilton Ave
- 63 Pond View Dr