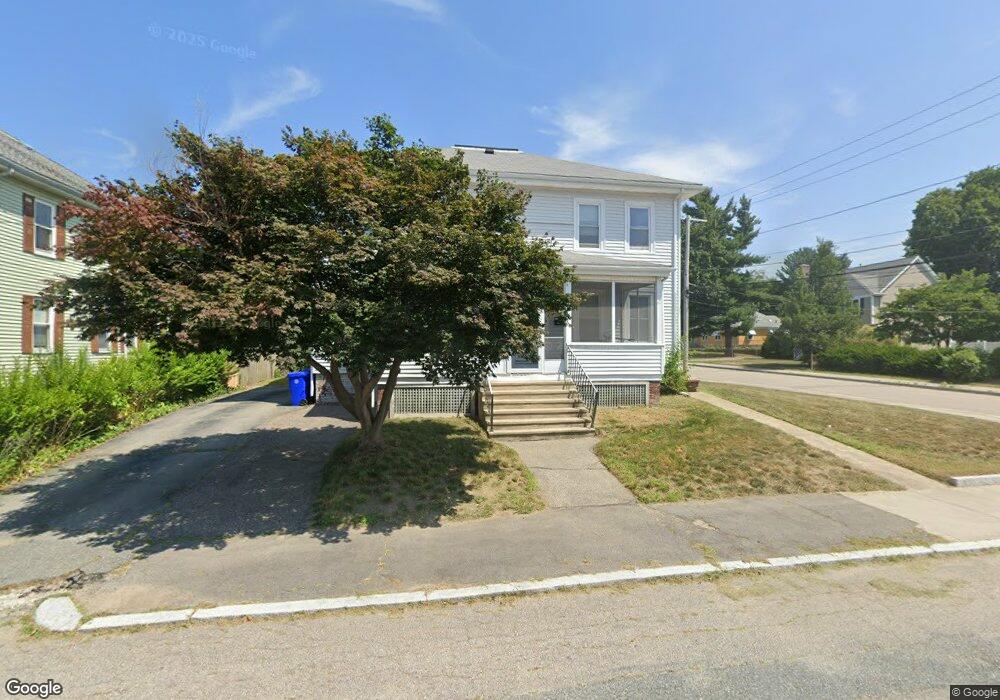
50 Mulberry St Attleboro, MA 02703
Estimated Value: $557,000 - $604,000
5
Beds
3
Baths
2,592
Sq Ft
$222/Sq Ft
Est. Value
About This Home
This home is located at 50 Mulberry St, Attleboro, MA 02703 and is currently estimated at $574,511, approximately $221 per square foot. 50 Mulberry St is a home located in Bristol County with nearby schools including Peter Thacher Elementary School, Wamsutta Middle School, and Attleboro High School.
Ownership History
Date
Name
Owned For
Owner Type
Purchase Details
Closed on
Sep 27, 2007
Sold by
Pelissey Anita G
Bought by
Folan Derek F and Folan Karen A
Current Estimated Value
Home Financials for this Owner
Home Financials are based on the most recent Mortgage that was taken out on this home.
Original Mortgage
$232,000
Outstanding Balance
$148,156
Interest Rate
6.65%
Mortgage Type
Purchase Money Mortgage
Estimated Equity
$426,355
Purchase Details
Closed on
Jul 27, 2007
Sold by
Ward Diane E
Bought by
Pelissey Anita G
Create a Home Valuation Report for This Property
The Home Valuation Report is an in-depth analysis detailing your home's value as well as a comparison with similar homes in the area
Home Values in the Area
Average Home Value in this Area
Purchase History
| Date | Buyer | Sale Price | Title Company |
|---|---|---|---|
| Folan Derek F | $290,000 | -- | |
| Pelissey Anita G | -- | -- |
Source: Public Records
Mortgage History
| Date | Status | Borrower | Loan Amount |
|---|---|---|---|
| Open | Folan Derek F | $232,000 |
Source: Public Records
Tax History Compared to Growth
Tax History
| Year | Tax Paid | Tax Assessment Tax Assessment Total Assessment is a certain percentage of the fair market value that is determined by local assessors to be the total taxable value of land and additions on the property. | Land | Improvement |
|---|---|---|---|---|
| 2025 | $5,223 | $416,200 | $108,400 | $307,800 |
| 2024 | $5,457 | $428,700 | $108,400 | $320,300 |
| 2023 | $4,787 | $349,700 | $98,500 | $251,200 |
| 2022 | $4,868 | $336,900 | $93,900 | $243,000 |
| 2021 | $4,114 | $278,000 | $90,200 | $187,800 |
| 2020 | $3,992 | $274,200 | $87,600 | $186,600 |
| 2019 | $3,505 | $247,500 | $85,900 | $161,600 |
| 2018 | $3,468 | $234,000 | $83,400 | $150,600 |
| 2017 | $3,150 | $216,500 | $83,400 | $133,100 |
| 2016 | $3,183 | $214,800 | $77,900 | $136,900 |
| 2015 | $2,820 | $191,700 | $77,900 | $113,800 |
| 2014 | $3,169 | $213,400 | $73,800 | $139,600 |
Source: Public Records
Map
Nearby Homes
- 46 Mulberry St
- 49 Mulberry St
- 40 Mulberry St
- 99 James St
- 108 James St
- 108 James St
- 43 Mulberry St
- 43 Mulberry St Unit 2nd floor
- 43 Mulberry St Unit 1
- 43 Mulberry St Unit 3
- 100 James St
- 94 Parker St
- 121 James St
- 59 Mulberry St
- 88 Parker St
- 47 Maple St
- 80 Parker St
- 45 Maple St
- 43 Maple St
- 35 Mulberry St Unit 2