Estimated Value: $288,000 - $338,000
2
Beds
2
Baths
1,171
Sq Ft
$260/Sq Ft
Est. Value
About This Home
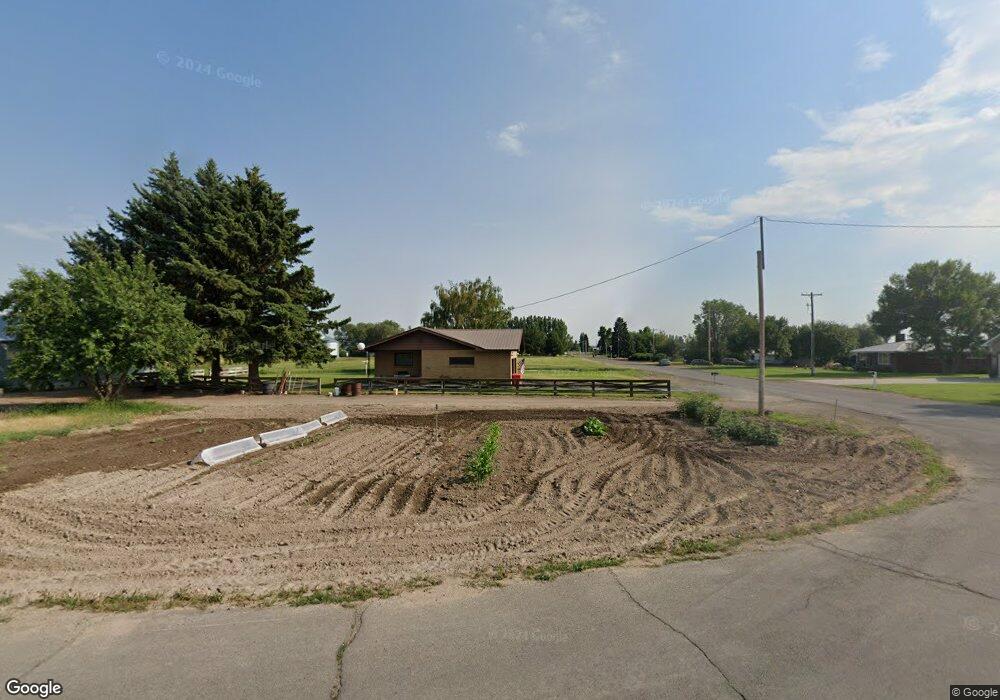
This home is located at 50 N 2500 E, Teton, ID 83451 and is currently estimated at $303,952, approximately $259 per square foot. 50 N 2500 E is a home located in Fremont County with nearby schools including Teton Elementary School, South Fremont Junior High School, and South Fremont High School.
Ownership History
Date
Name
Owned For
Owner Type
Purchase Details
Closed on
Dec 3, 2020
Sold by
Arnold Heather and Alt Heather
Bought by
Arnold Jesse
Current Estimated Value
Purchase Details
Closed on
Nov 18, 2009
Sold by
Palmer Joseph J and Palmer Tiffany V
Bought by
Arnold Jesse and Arnold Heather
Home Financials for this Owner
Home Financials are based on the most recent Mortgage that was taken out on this home.
Original Mortgage
$129,081
Interest Rate
4.83%
Mortgage Type
New Conventional
Purchase Details
Closed on
Nov 16, 2007
Sold by
Gittins Nathan Scott and Gittins Kristin
Bought by
Palmer Joseph J and Palmer Tiffany
Home Financials for this Owner
Home Financials are based on the most recent Mortgage that was taken out on this home.
Original Mortgage
$2,340
Interest Rate
6.35%
Mortgage Type
Stand Alone Second
Create a Home Valuation Report for This Property
The Home Valuation Report is an in-depth analysis detailing your home's value as well as a comparison with similar homes in the area
Purchase History
| Date | Buyer | Sale Price | Title Company |
|---|---|---|---|
| Arnold Jesse | -- | None Listed On Document | |
| Arnold Jesse | -- | -- | |
| Palmer Joseph J | -- | -- |
Source: Public Records
Mortgage History
| Date | Status | Borrower | Loan Amount |
|---|---|---|---|
| Previous Owner | Arnold Jesse | $129,081 | |
| Previous Owner | Palmer Joseph J | $2,340 |
Source: Public Records
Tax History
| Year | Tax Paid | Tax Assessment Tax Assessment Total Assessment is a certain percentage of the fair market value that is determined by local assessors to be the total taxable value of land and additions on the property. | Land | Improvement |
|---|---|---|---|---|
| 2025 | $546 | $98,353 | $51,087 | $47,266 |
| 2024 | $548 | $96,578 | $51,087 | $45,491 |
| 2023 | $518 | $96,578 | $51,087 | $45,491 |
| 2022 | $663 | $77,380 | $41,087 | $36,293 |
| 2021 | $608 | $51,719 | $24,569 | $27,150 |
| 2020 | $613 | $48,878 | $24,569 | $24,309 |
| 2019 | $608 | $48,878 | $24,569 | $24,309 |
| 2018 | $609 | $46,395 | $24,569 | $21,826 |
| 2017 | $7 | $44,926 | $23,832 | $21,094 |
| 2016 | $696 | $44,926 | $23,832 | $21,094 |
| 2015 | $673 | $86,459 | $0 | $0 |
| 2014 | $437 | $43,227 | $0 | $0 |
| 2013 | $437 | $43,227 | $0 | $0 |
Source: Public Records
Map
Nearby Homes
- 209 E Main St
- 264 E 1st S
- 3774 E Highway 33
- Lot 22 N Wilford Rd
- Lot 16 N Wilford Rd
- Lot 18 N Wilford Rd
- Lot 10 N Wilford Rd
- Lot 8 N Wilford Rd
- Lot 7 N Wilford Rd
- Lot 5 N Wilford Rd
- Lot 25 N Wilford Rd
- Lot 1 N Wilford Rd
- Lot 11 N Wilford Rd
- Lot 13 N Wilford Rd
- Lot 28 N Wilford Rd
- Lot 21 N Wilford Rd
- Lot 4 N Wilford Rd
- Lot 26 N Wilford Rd
- Lot 2 N Wilford Rd
- Lot 15 N Wilford Rd
Your Personal Tour Guide
Ask me questions while you tour the home.