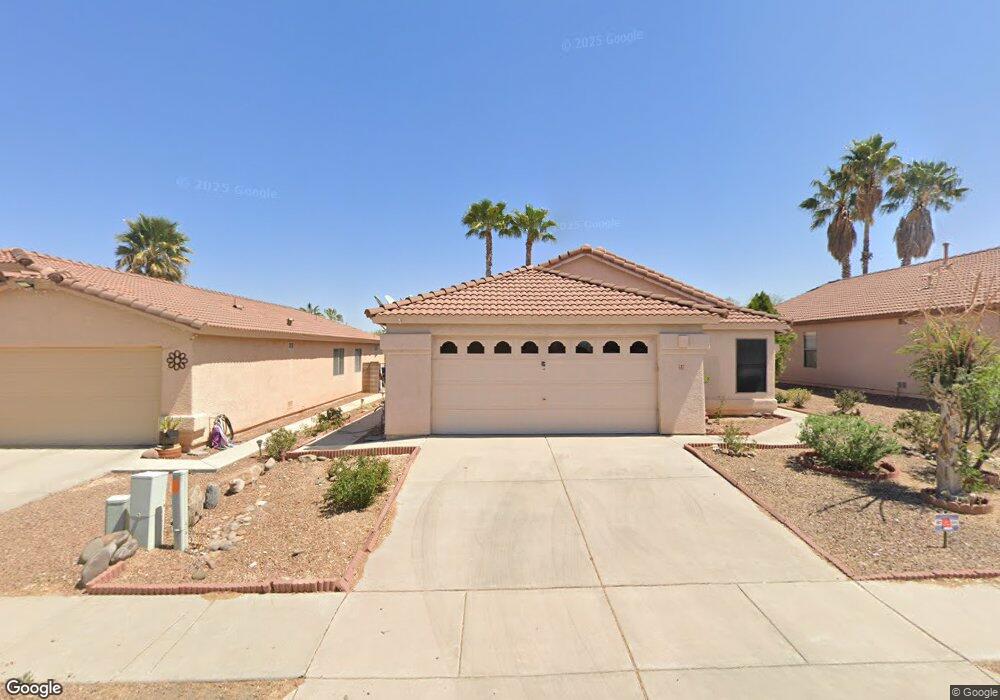
50 N Shadow Brook Place Tucson, AZ 85748
Eastside NeighborhoodEstimated Value: $313,000 - $341,000
--
Bed
2
Baths
1,333
Sq Ft
$244/Sq Ft
Est. Value
About This Home
This home is located at 50 N Shadow Brook Place, Tucson, AZ 85748 and is currently estimated at $324,920, approximately $243 per square foot. 50 N Shadow Brook Place is a home located in Pima County with nearby schools including Anna Henry Elementary School, Gridley Middle School, and Sahuaro High School.
Ownership History
Date
Name
Owned For
Owner Type
Purchase Details
Closed on
Apr 19, 2012
Sold by
Hellpap Wolfgang H
Bought by
Hellpap Wolfgang H and Hellpap Vilma R
Current Estimated Value
Purchase Details
Closed on
Apr 25, 2008
Sold by
Hellpap Wolfgang and Hellpap Vilma
Bought by
Hellpap Wolfgang
Home Financials for this Owner
Home Financials are based on the most recent Mortgage that was taken out on this home.
Original Mortgage
$330,000
Outstanding Balance
$174,795
Interest Rate
2.92%
Mortgage Type
Reverse Mortgage Home Equity Conversion Mortgage
Estimated Equity
$150,125
Purchase Details
Closed on
Jul 18, 2005
Sold by
Detrick Thelma L
Bought by
Hellpap Wolfgang and Hellpap Vilma
Purchase Details
Closed on
Sep 26, 1997
Sold by
Title Security Agency Of Arizona
Bought by
Detrick Thebert C and Detrick Thelma L
Create a Home Valuation Report for This Property
The Home Valuation Report is an in-depth analysis detailing your home's value as well as a comparison with similar homes in the area
Home Values in the Area
Average Home Value in this Area
Purchase History
| Date | Buyer | Sale Price | Title Company |
|---|---|---|---|
| Hellpap Wolfgang H | -- | None Available | |
| Hellpap Wolfgang H | -- | None Available | |
| Hellpap Wolfgang | -- | First American Title | |
| Hellpap Wolfgang | -- | First American Title | |
| Hellpap Wolfgang | $224,000 | -- | |
| Detrick Thebert C | $113,485 | -- |
Source: Public Records
Mortgage History
| Date | Status | Borrower | Loan Amount |
|---|---|---|---|
| Open | Hellpap Wolfgang | $330,000 | |
| Closed | Hellpap Wolfgang | $330,000 |
Source: Public Records
Tax History Compared to Growth
Tax History
| Year | Tax Paid | Tax Assessment Tax Assessment Total Assessment is a certain percentage of the fair market value that is determined by local assessors to be the total taxable value of land and additions on the property. | Land | Improvement |
|---|---|---|---|---|
| 2025 | $1,769 | $20,537 | -- | -- |
| 2024 | $1,646 | $19,559 | -- | -- |
| 2023 | $2,167 | $18,628 | $0 | $0 |
| 2022 | $2,167 | $17,741 | $0 | $0 |
| 2021 | $2,195 | $16,244 | $0 | $0 |
| 2020 | $2,107 | $16,244 | $0 | $0 |
| 2019 | $2,046 | $15,934 | $0 | $0 |
| 2018 | $1,952 | $14,032 | $0 | $0 |
| 2017 | $1,863 | $14,032 | $0 | $0 |
| 2016 | $1,887 | $13,886 | $0 | $0 |
| 2015 | $1,805 | $13,225 | $0 | $0 |
Source: Public Records
Map
Nearby Homes
- 49 N Camino de La Reflexion
- 9735 E Shiloh St
- 9761 E Cinder Ct
- 10161 E Queensgate Way
- 9734 E Cannon Place
- 10070 E English Woods Rd
- 9716 E Hollow Place
- 10080 E English Woods Rd
- 360 S Marango Ln
- 250 S Sonoran Heights Dr
- 350 N Schrader Ln
- 411 S Marango Ln
- 9562 E Shiloh St
- 506 N Banff Ave
- 9520 E Evita Ln
- 10520 E Blue Marble St
- 10338 E Red Slate Place
- Finch Plan at Houghton Reserve - Esplanade
- Vineyard Plan at Houghton Reserve - Alameda
- Dove Plan at Houghton Reserve - Esplanade
- 38 N Shadow Brook Place
- 62 N Shadow Brook Place
- 26 N Shadow Brook Place
- 74 N Shadow Brook Place
- 51 N Shadow Brook Place
- 14 N Shadow Brook Place
- 63 N Shadow Brook Place
- 86 N Shadow Brook Place
- 9920 E Shadow Glen Ct
- 75 N Shadow Brook Place
- 87 N Shadow Brook Place
- 9914 E Shadow Glen Ct
- 10008 E Karen Place
- 9885 E Shadow Glen Ct
- 9908 E Shadow Glen Ct
- 10001 E Karen Place
- 9879 E Shadow Glen Ct
- 9952 E Shiloh St
- 9873 E Shadow Glen Ct
- 9873 E Shadow Glen Ct