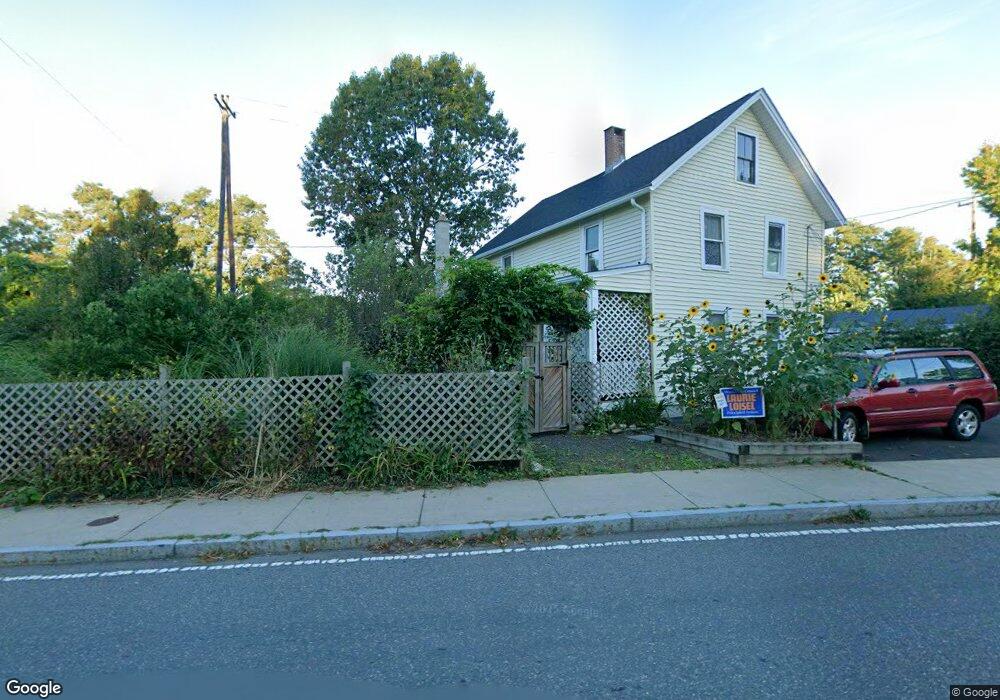
50 North St Northampton, MA 01060
Estimated Value: $476,000 - $705,000
3
Beds
3
Baths
1,855
Sq Ft
$316/Sq Ft
Est. Value
About This Home
This home is located at 50 North St, Northampton, MA 01060 and is currently estimated at $585,997, approximately $315 per square foot. 50 North St is a home located in Hampshire County with nearby schools including Northampton High School, Hilltown Cooperative Charter Public School, and Pioneer Valley Chinese Immersion Charter School.
Ownership History
Date
Name
Owned For
Owner Type
Purchase Details
Closed on
Jun 3, 2011
Sold by
Leblanc William and Stabile John T
Bought by
Creely Ann L and Parot Brigitte M
Current Estimated Value
Home Financials for this Owner
Home Financials are based on the most recent Mortgage that was taken out on this home.
Original Mortgage
$135,000
Outstanding Balance
$9,324
Interest Rate
4.85%
Mortgage Type
Purchase Money Mortgage
Estimated Equity
$576,673
Purchase Details
Closed on
Nov 26, 2003
Sold by
Shinnick Philip J
Bought by
Stabile John T and Stabile Pamela C
Home Financials for this Owner
Home Financials are based on the most recent Mortgage that was taken out on this home.
Original Mortgage
$180,000
Interest Rate
6.09%
Mortgage Type
Purchase Money Mortgage
Purchase Details
Closed on
Aug 30, 1999
Sold by
Langheld Paul Sr Est
Bought by
Shinnick Phillip J
Create a Home Valuation Report for This Property
The Home Valuation Report is an in-depth analysis detailing your home's value as well as a comparison with similar homes in the area
Home Values in the Area
Average Home Value in this Area
Purchase History
We collect this data history from publicly available records. To have your information removed, we recommend requesting removal directly through your county’s website.
| Date | Buyer | Sale Price | Title Company |
|---|---|---|---|
| Creely Ann L | $175,500 | -- | |
| Stabile John T | $280,000 | -- | |
| Shinnick Phillip J | $120,000 | -- |
Source: Public Records
Mortgage History
We collect this data history from publicly available records. To have your information removed, we recommend requesting removal directly through your county’s website.
| Date | Status | Borrower | Loan Amount |
|---|---|---|---|
| Open | Creely Ann L | $135,000 | |
| Previous Owner | Shinnick Phillip J | $50,000 | |
| Previous Owner | Shinnick Phillip J | $180,000 |
Source: Public Records
Tax History
| Year | Tax Paid | Tax Assessment Tax Assessment Total Assessment is a certain percentage of the fair market value that is determined by local assessors to be the total taxable value of land and additions on the property. | Land | Improvement |
|---|---|---|---|---|
| 2025 | $6,320 | $453,700 | $138,100 | $315,600 |
| 2024 | $5,657 | $372,400 | $158,300 | $214,100 |
| 2023 | $5,720 | $361,100 | $143,900 | $217,200 |
| 2022 | $5,530 | $309,100 | $134,500 | $174,600 |
| 2021 | $4,867 | $280,200 | $128,100 | $152,100 |
| 2020 | $4,707 | $280,200 | $128,100 | $152,100 |
| 2019 | $4,659 | $268,200 | $128,100 | $140,100 |
| 2018 | $4,323 | $253,700 | $128,100 | $125,600 |
| 2017 | $4,234 | $253,700 | $128,100 | $125,600 |
| 2016 | $4,100 | $253,700 | $128,100 | $125,600 |
| 2015 | $4,411 | $279,200 | $120,600 | $158,600 |
| 2014 | $4,297 | $279,200 | $120,600 | $158,600 |
Source: Public Records
Map
Nearby Homes
- 0 N King St
- 20 View Ave
- 37 Finn St
- 19 Trumbull Rd
- 155 Prospect St
- 43 Center St Unit K
- 26 Crescent St Unit G2
- 30 Pleasant St Unit 5
- 14 Khloe Ln
- 11 Khloe Ln
- 12 Khloe Ln
- 18 Khloe Ln
- 10 Khloe Ln
- 16 Khloe Ln
- 17 Khloe Ln
- 1 Williams St Unit 1A
- 23 Eastern Ave
- 244 Main St
- 351 Bridge St
- 35 New South St Unit 402
Your Personal Tour Guide
Ask me questions while you tour the home.