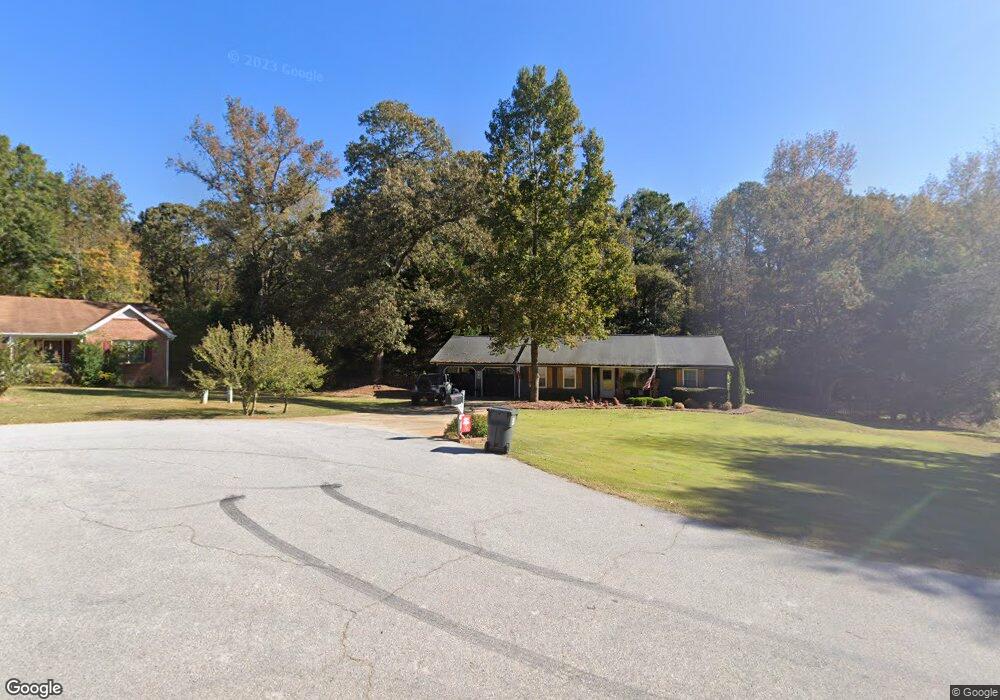
50 Oakbrook Ct Covington, GA 30016
Estimated Value: $238,000 - $253,000
3
Beds
2
Baths
1,375
Sq Ft
$180/Sq Ft
Est. Value
About This Home
This home is located at 50 Oakbrook Ct, Covington, GA 30016 and is currently estimated at $247,674, approximately $180 per square foot. 50 Oakbrook Ct is a home located in Newton County with nearby schools including Oak Hill Elementary School, Veterans Memorial Middle School, and Alcovy High School.
Ownership History
Date
Name
Owned For
Owner Type
Purchase Details
Closed on
Jan 16, 2024
Sold by
Collum Lauralee Cambron
Bought by
Collum Lauralee Cambron and Mccurley Chad Thomas
Current Estimated Value
Purchase Details
Closed on
Nov 9, 2016
Sold by
Stevens James C
Bought by
Johnson Lauralee Cambron
Home Financials for this Owner
Home Financials are based on the most recent Mortgage that was taken out on this home.
Original Mortgage
$68,875
Interest Rate
3.47%
Mortgage Type
New Conventional
Purchase Details
Closed on
Jul 18, 2005
Sold by
50 Oakbrook Ct Land
Bought by
Stevens James C
Home Financials for this Owner
Home Financials are based on the most recent Mortgage that was taken out on this home.
Original Mortgage
$89,900
Interest Rate
5.86%
Mortgage Type
New Conventional
Purchase Details
Closed on
Aug 26, 2003
Sold by
Kelly Robert
Bought by
Unto Freeport Title Guaranty Inc
Purchase Details
Closed on
Jun 3, 2003
Sold by
Baker Ruth M and Baker Carl
Bought by
Kelly Robert W
Create a Home Valuation Report for This Property
The Home Valuation Report is an in-depth analysis detailing your home's value as well as a comparison with similar homes in the area
Home Values in the Area
Average Home Value in this Area
Purchase History
| Date | Buyer | Sale Price | Title Company |
|---|---|---|---|
| Collum Lauralee Cambron | -- | -- | |
| Johnson Lauralee Cambron | $72,500 | -- | |
| Stevens James C | $99,900 | -- | |
| Unto Freeport Title Guaranty Inc | -- | -- | |
| Kelly Robert W | $79,500 | -- |
Source: Public Records
Mortgage History
| Date | Status | Borrower | Loan Amount |
|---|---|---|---|
| Previous Owner | Johnson Lauralee Cambron | $68,875 | |
| Previous Owner | Stevens James C | $89,900 |
Source: Public Records
Tax History
| Year | Tax Paid | Tax Assessment Tax Assessment Total Assessment is a certain percentage of the fair market value that is determined by local assessors to be the total taxable value of land and additions on the property. | Land | Improvement |
|---|---|---|---|---|
| 2025 | $2,129 | $91,560 | $16,800 | $74,760 |
| 2024 | $2,056 | $85,040 | $16,800 | $68,240 |
| 2023 | $2,096 | $81,120 | $5,600 | $75,520 |
| 2022 | $1,613 | $63,320 | $5,600 | $57,720 |
| 2021 | $1,704 | $60,080 | $5,600 | $54,480 |
| 2020 | $995 | $33,520 | $5,600 | $27,920 |
| 2019 | $1,051 | $34,720 | $5,600 | $29,120 |
| 2018 | $1,018 | $33,560 | $5,600 | $27,960 |
| 2017 | $870 | $29,240 | $5,600 | $23,640 |
| 2016 | $908 | $26,440 | $3,800 | $22,640 |
| 2015 | $890 | $25,920 | $3,200 | $22,720 |
| 2014 | $887 | $25,920 | $0 | $0 |
Source: Public Records
Map
Nearby Homes
- 1925 Oak Hill Rd
- 2215 Oak Hill Rd
- 170 Gibson Way
- 35 Fourwood Dr
- 14908 Brown Bridge Rd
- 125 Cardinal Ct Unit 1
- 0 Goldfinch Dr
- 0 Goldfinch Dr Unit 7564125
- 20 W Forest Dr
- 5737 Highway 20 S
- 5240 Highway 20 S
- 110 Chapel Heights Way
- 125 Goldfinch Dr
- 130 Goldfinch Dr
- 130 Berkshire Dr
- 425 Berkshire Dr
- 185 Wilson Rd
- 120 Wintergreen Ct
- 5214 Parkside Dr SE
- 6023 Highway 20 S
- 60 Oakbrook Ct
- 40 Oakbrook Ct
- 55 Oakbrook Ct
- 65 Oakbrook Ct
- 45 Oakbrook Ct
- 35 Oakbrook Ct
- 20 Oakbrook Ct Unit 14
- 20 Oakbrook Ct
- 25 Oakbrook Ct
- 10 Oakbrook Ct Unit 13
- 10 Oakbrook Ct
- 65 Oak Crest Ct
- 15 Oakbrook Ct
- 15 Oakbrook Ct Unit 24
- 55 Oak Crest Ct
- 55 Oak Crest Ct
- 75 Oak Crest Ct
- 45 Oak Crest Ct
- 6806 Highway 212
- 35 Oak Crest Ct
Your Personal Tour Guide
Ask me questions while you tour the home.