50 Ocean Ave Salem, MA 01970
South Salem NeighborhoodEstimated Value: $797,202 - $1,083,000
6
Beds
3
Baths
2,921
Sq Ft
$305/Sq Ft
Est. Value
About This Home
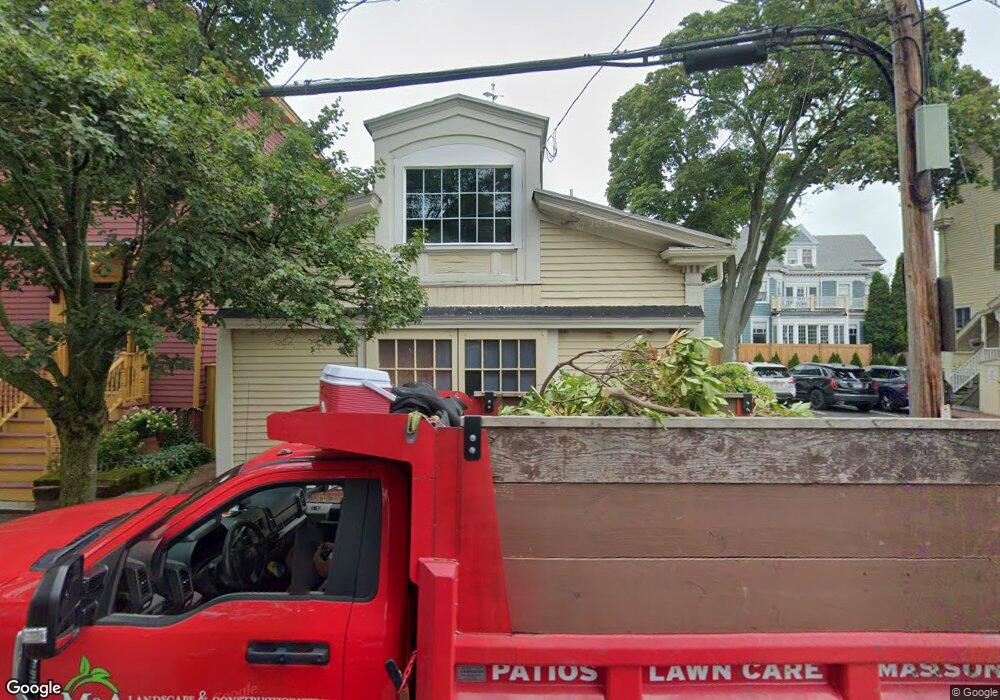
This home is located at 50 Ocean Ave, Salem, MA 01970 and is currently estimated at $891,301, approximately $305 per square foot. 50 Ocean Ave is a home located in Essex County with nearby schools including Saltonstall School, Horace Mann Laboratory, and Carlton Elementary School.
Ownership History
Date
Name
Owned For
Owner Type
Purchase Details
Closed on
Aug 1, 1996
Sold by
Canavan Mary E Est
Bought by
Ampey Sullivan Kevin P and Ampey Sullivan Carol A
Current Estimated Value
Home Financials for this Owner
Home Financials are based on the most recent Mortgage that was taken out on this home.
Original Mortgage
$138,190
Interest Rate
8.27%
Mortgage Type
Purchase Money Mortgage
Create a Home Valuation Report for This Property
The Home Valuation Report is an in-depth analysis detailing your home's value as well as a comparison with similar homes in the area
Home Values in the Area
Average Home Value in this Area
Purchase History
| Date | Buyer | Sale Price | Title Company |
|---|---|---|---|
| Ampey Sullivan Kevin P | $140,000 | -- |
Source: Public Records
Mortgage History
| Date | Status | Borrower | Loan Amount |
|---|---|---|---|
| Open | Ampey Sullivan Kevin P | $195,000 | |
| Closed | Ampey Sullivan Kevin P | $200,000 | |
| Closed | Ampey Sullivan Kevin P | $180,000 | |
| Closed | Ampey Sullivan Kevin P | $138,190 |
Source: Public Records
Tax History
| Year | Tax Paid | Tax Assessment Tax Assessment Total Assessment is a certain percentage of the fair market value that is determined by local assessors to be the total taxable value of land and additions on the property. | Land | Improvement |
|---|---|---|---|---|
| 2025 | $7,977 | $703,400 | $172,300 | $531,100 |
| 2024 | $7,484 | $644,100 | $163,200 | $480,900 |
| 2023 | $7,231 | $578,000 | $151,100 | $426,900 |
| 2022 | $7,350 | $554,700 | $142,100 | $412,600 |
| 2021 | $7,103 | $514,700 | $142,100 | $372,600 |
| 2020 | $6,596 | $456,500 | $122,700 | $333,800 |
| 2019 | $6,519 | $431,700 | $116,700 | $315,000 |
| 2018 | $5,997 | $389,900 | $111,200 | $278,700 |
| 2017 | $5,570 | $351,200 | $90,700 | $260,500 |
| 2016 | $5,427 | $346,300 | $85,800 | $260,500 |
| 2015 | $5,243 | $319,500 | $77,400 | $242,100 |
Source: Public Records
Map
Nearby Homes
- 24 Wisteria St Unit 2
- 4 Willow Ave Unit 2
- 326 Lafayette St Unit 2
- 29 Ocean Ave Unit 4
- 10 Hazel St Unit 2
- 6R Hazel Terrace Unit 1
- 13 Roslyn St Unit 2
- 1 Shore Ave
- 59 Leach St Unit 2
- 9 Glover St Unit 1
- 106 Broadway Unit 3
- 4 Fairview Rd
- 7 Fairfield St
- 3 Chase St
- 259 Jefferson Ave
- 263 Jefferson Ave
- 79 Lawrence St
- 185 Lafayette St Unit 3
- 6 Arthur St Unit 3
- 88 Congress St Unit 3
- 52 Ocean Ave
- 56 Ocean Ave
- 284 Lafayette St
- 278 Lafayette St Unit 4
- 278 Lafayette St Unit 1
- 278 Lafayette St Unit R
- 278 Lafayette St Unit 3
- 278 Lafayette St Unit 2
- 278 Lafayette St Unit 5
- 278 Lafayette St
- 53 Ocean Ave Unit 2
- 51 Ocean Ave Unit 3
- 53 Ocean Ave
- 51 Ocean Ave Unit 1
- 25 Linden St
- 58 Ocean Ave
- 49 Ocean Ave
- 23 Linden St
- 55 Ocean Ave Unit 3
- 55 Ocean Ave Unit 2
Your Personal Tour Guide
Ask me questions while you tour the home.