Estimated Value: $453,226 - $588,000
1
Bed
1
Bath
895
Sq Ft
$583/Sq Ft
Est. Value
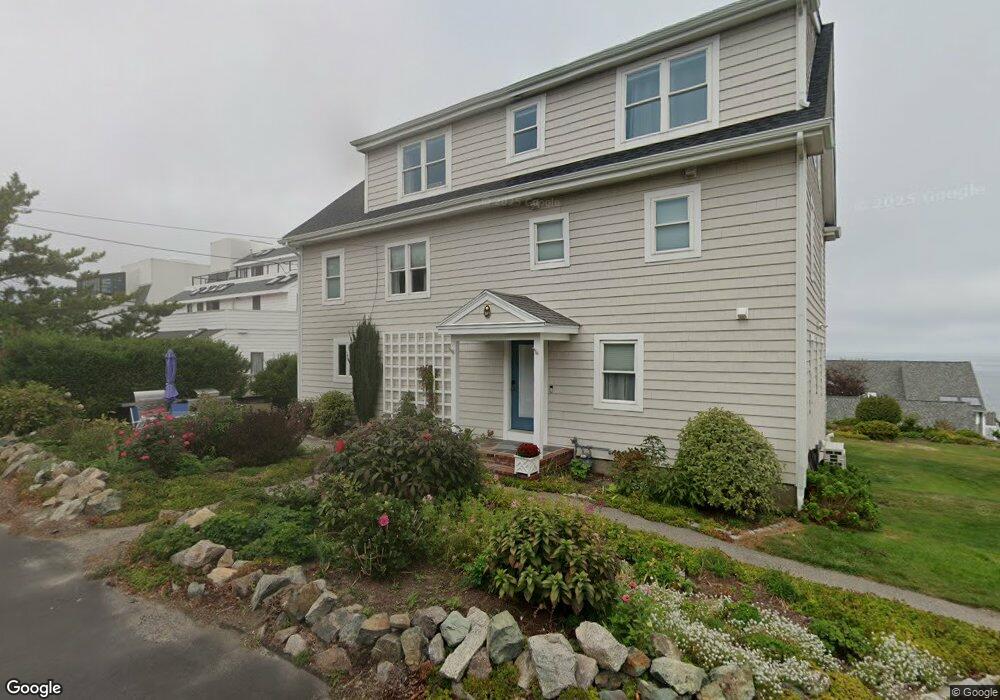
About This Home
This home is located at 50 Oceanside Dr, Hull, MA 02045 and is currently estimated at $521,807, approximately $583 per square foot. 50 Oceanside Dr is a home located in Plymouth County with nearby schools including Lillian M. Jacobs Elementary School, Memorial Middle School, and Hull High School.
Ownership History
Date
Name
Owned For
Owner Type
Purchase Details
Closed on
Oct 24, 2008
Sold by
Fhlmc
Bought by
Hafferty Elizabeth A
Current Estimated Value
Home Financials for this Owner
Home Financials are based on the most recent Mortgage that was taken out on this home.
Original Mortgage
$243,920
Interest Rate
5.94%
Mortgage Type
Purchase Money Mortgage
Purchase Details
Closed on
Aug 4, 2008
Sold by
Price Joan Casey and Gmac Mortgage Llc
Bought by
Fhlmc
Purchase Details
Closed on
Aug 26, 2005
Sold by
Prudential Res Svcs and Prudential Homes Corp
Bought by
Price Jerry L and Price Joan Casey
Home Financials for this Owner
Home Financials are based on the most recent Mortgage that was taken out on this home.
Original Mortgage
$314,400
Interest Rate
5.68%
Mortgage Type
Purchase Money Mortgage
Purchase Details
Closed on
Jul 17, 1997
Sold by
Kenyan John M and Kenyan Karen
Bought by
Brady Steven E
Create a Home Valuation Report for This Property
The Home Valuation Report is an in-depth analysis detailing your home's value as well as a comparison with similar homes in the area
Purchase History
| Date | Buyer | Sale Price | Title Company |
|---|---|---|---|
| Hafferty Elizabeth A | $304,900 | -- | |
| Fhlmc | $236,600 | -- | |
| Price Jerry L | $393,000 | -- | |
| Prudential Res Svcs | $393,000 | -- | |
| Brady Steven E | $119,000 | -- |
Source: Public Records
Mortgage History
| Date | Status | Borrower | Loan Amount |
|---|---|---|---|
| Open | Brady Steven E | $241,275 | |
| Closed | Brady Steven E | $243,920 | |
| Previous Owner | Brady Steven E | $314,400 |
Source: Public Records
Tax History
| Year | Tax Paid | Tax Assessment Tax Assessment Total Assessment is a certain percentage of the fair market value that is determined by local assessors to be the total taxable value of land and additions on the property. | Land | Improvement |
|---|---|---|---|---|
| 2025 | $5,169 | $461,500 | $0 | $461,500 |
| 2024 | $5,159 | $442,800 | $0 | $442,800 |
| 2023 | $5,276 | $433,500 | $0 | $433,500 |
| 2022 | $5,031 | $401,200 | $0 | $401,200 |
| 2021 | $5,087 | $401,200 | $0 | $401,200 |
| 2020 | $5,290 | $412,600 | $0 | $412,600 |
| 2019 | $5,216 | $399,700 | $0 | $399,700 |
| 2018 | $5,152 | $375,500 | $0 | $375,500 |
| 2017 | $5,152 | $375,500 | $0 | $375,500 |
| 2016 | $5,016 | $372,100 | $0 | $372,100 |
| 2015 | $4,557 | $326,900 | $0 | $326,900 |
| 2014 | $3,886 | $280,200 | $0 | $280,200 |
Source: Public Records
Map
Nearby Homes
- 62 Oceanside Dr
- 1 Longbeach Ave Unit 202
- 6 State Park Rd Unit 2
- 121 Nantasket Ave Unit 503
- 99 Nantasket Ave
- 4 Atherton Rd
- 22 Berkley Rd Unit B
- 0 Seaview Ave
- 23 Wyola Rd
- 181 Atlantic Ave
- 155 George Washington Blvd Unit 210
- 2 Cliff Rd
- 137 Hampton Cir
- 166 Hull St
- 127 Hampton Cir
- 3 3rd St
- 15 Lincoln Ave
- 597 Jerusalem Rd
- 560 Jerusalem Rd
- 114 Hull St
- 63 Oceanside Dr
- 61 Oceanside Dr
- 59 Oceanside Dr
- 58 Oceanside Dr
- 57 Oceanside Dr
- 56 Oceanside Dr
- 55 Oceanside Dr
- 54 Oceanside Dr
- 53 Oceanside Dr
- 51 Oceanside Dr
- 49 Oceanside Dr
- 48 Oceanside Dr
- 47 Oceanside Dr
- 46 Oceanside Dr
- 45 Oceanside Dr
- 44 Oceanside Dr
- 43 Oceanside Dr
- 40 Oceanside Dr
- 37 Oceanside Dr
- 36 Oceanside Dr
Your Personal Tour Guide
Ask me questions while you tour the home.