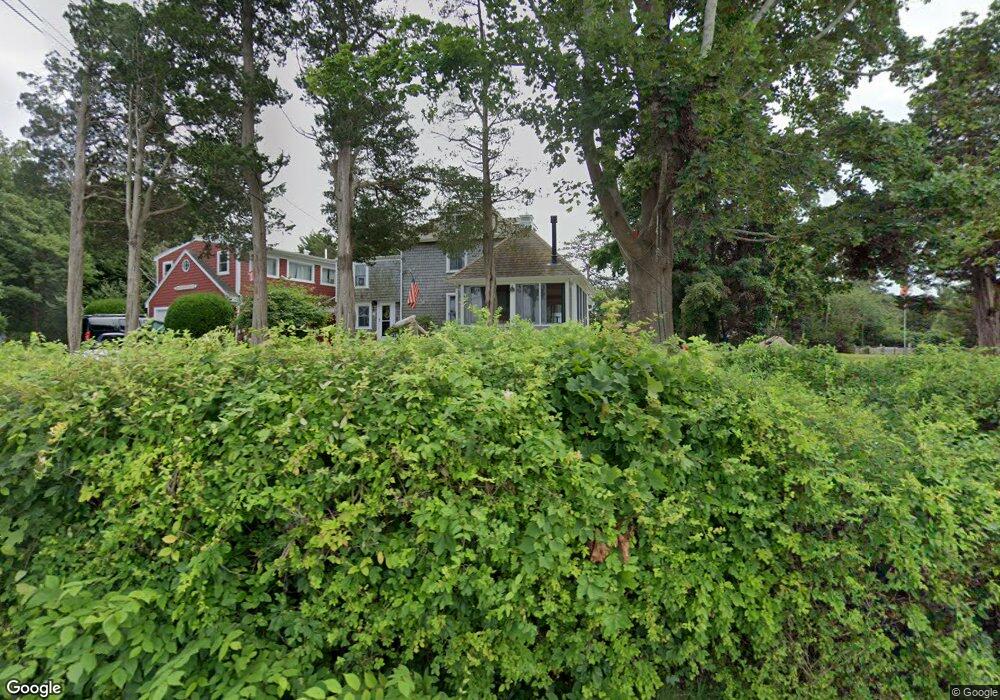
50 Old Dock Rd Falmouth, MA 02540
Estimated Value: $1,131,000 - $2,020,000
3
Beds
2
Baths
2,217
Sq Ft
$694/Sq Ft
Est. Value
About This Home
This home is located at 50 Old Dock Rd, Falmouth, MA 02540 and is currently estimated at $1,539,667, approximately $694 per square foot. 50 Old Dock Rd is a home located in Barnstable County with nearby schools including North Falmouth Elementary School, Morse Pond School, and Lawrence School.
Ownership History
Date
Name
Owned For
Owner Type
Purchase Details
Closed on
Jun 4, 2020
Sold by
Funfar Diane C and Fundar Kristin D
Bought by
Funfar Kristi D
Current Estimated Value
Purchase Details
Closed on
Jan 26, 2017
Sold by
Funfar Kristi D and Funfar Barry A
Bought by
Funfar Diane and Funfar Kristi D
Purchase Details
Closed on
May 16, 2012
Sold by
Pokraka Gary S and Pokraka Kristi D
Bought by
Pokraka Kristi D
Purchase Details
Closed on
Jul 1, 2002
Sold by
Funfar Barry A and Funfar Diane C
Bought by
Pokraka Gary S and Pokraka Kristi D
Home Financials for this Owner
Home Financials are based on the most recent Mortgage that was taken out on this home.
Original Mortgage
$170,000
Interest Rate
6.92%
Mortgage Type
Purchase Money Mortgage
Create a Home Valuation Report for This Property
The Home Valuation Report is an in-depth analysis detailing your home's value as well as a comparison with similar homes in the area
Home Values in the Area
Average Home Value in this Area
Purchase History
| Date | Buyer | Sale Price | Title Company |
|---|---|---|---|
| Funfar Kristi D | -- | None Available | |
| Funfar Kristi D | -- | None Available | |
| Funfar Diane | -- | -- | |
| Funfar Diane | -- | -- | |
| Pokraka Kristi D | -- | -- | |
| Pokraka Kristi D | -- | -- | |
| Pokraka Gary S | $310,000 | -- | |
| Pokraka Gary S | $310,000 | -- |
Source: Public Records
Mortgage History
| Date | Status | Borrower | Loan Amount |
|---|---|---|---|
| Previous Owner | Pokraka Gary S | $170,000 |
Source: Public Records
Tax History Compared to Growth
Tax History
| Year | Tax Paid | Tax Assessment Tax Assessment Total Assessment is a certain percentage of the fair market value that is determined by local assessors to be the total taxable value of land and additions on the property. | Land | Improvement |
|---|---|---|---|---|
| 2025 | $8,403 | $1,431,500 | $913,500 | $518,000 |
| 2024 | $7,969 | $1,268,900 | $792,700 | $476,200 |
| 2023 | $7,586 | $1,096,200 | $792,700 | $303,500 |
| 2022 | $8,275 | $1,028,000 | $769,600 | $258,400 |
| 2021 | $7,891 | $928,400 | $705,400 | $223,000 |
| 2020 | $7,424 | $864,300 | $641,300 | $223,000 |
| 2019 | $7,382 | $862,400 | $641,300 | $221,100 |
| 2018 | $7,470 | $854,800 | $641,300 | $213,500 |
| 2017 | $7,222 | $846,700 | $641,300 | $205,400 |
| 2016 | $7,087 | $846,700 | $641,300 | $205,400 |
| 2015 | $6,934 | $846,700 | $641,300 | $205,400 |
| 2014 | $6,890 | $845,400 | $641,400 | $204,000 |
Source: Public Records
Map
Nearby Homes