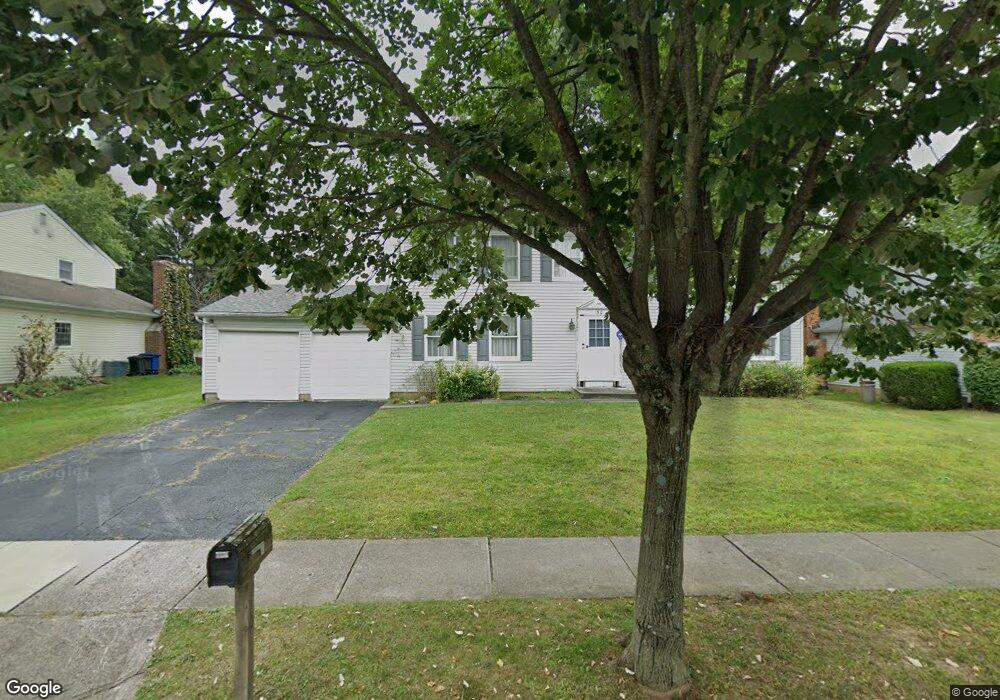
50 Ormsbee Ave Westerville, OH 43081
Estimated Value: $425,090 - $479,000
4
Beds
3
Baths
2,320
Sq Ft
$193/Sq Ft
Est. Value
About This Home
This home is located at 50 Ormsbee Ave, Westerville, OH 43081 and is currently estimated at $448,273, approximately $193 per square foot. 50 Ormsbee Ave is a home located in Franklin County with nearby schools including Annehurst Elementary School, Heritage Middle School, and Westerville South High School.
Ownership History
Date
Name
Owned For
Owner Type
Purchase Details
Closed on
Nov 9, 2023
Sold by
Kromer Melissa R
Bought by
Melissa A Kromer Revocable Living Trust and Kromer
Current Estimated Value
Purchase Details
Closed on
Aug 8, 2023
Sold by
Kromer Melissa R
Bought by
Melissa A Kromer Revocable Living Trust and Kromer
Purchase Details
Closed on
Dec 17, 2002
Sold by
Kromer John D
Bought by
Kromer Melissa A
Home Financials for this Owner
Home Financials are based on the most recent Mortgage that was taken out on this home.
Original Mortgage
$125,000
Interest Rate
7.37%
Purchase Details
Closed on
Dec 9, 2002
Sold by
Kromer John David
Bought by
Kromer Melissa R
Home Financials for this Owner
Home Financials are based on the most recent Mortgage that was taken out on this home.
Original Mortgage
$125,000
Interest Rate
7.37%
Purchase Details
Closed on
Sep 19, 1988
Bought by
Kromer John D
Purchase Details
Closed on
Apr 1, 1980
Create a Home Valuation Report for This Property
The Home Valuation Report is an in-depth analysis detailing your home's value as well as a comparison with similar homes in the area
Home Values in the Area
Average Home Value in this Area
Purchase History
| Date | Buyer | Sale Price | Title Company |
|---|---|---|---|
| Melissa A Kromer Revocable Living Trust | -- | None Listed On Document | |
| Melissa A Kromer Revocable Living Trust | -- | None Listed On Document | |
| Kromer Melissa A | -- | -- | |
| Kromer Melissa R | -- | -- | |
| Kromer John D | $123,000 | -- | |
| -- | $82,300 | -- |
Source: Public Records
Mortgage History
| Date | Status | Borrower | Loan Amount |
|---|---|---|---|
| Previous Owner | Kromer Melissa R | $125,000 |
Source: Public Records
Tax History
| Year | Tax Paid | Tax Assessment Tax Assessment Total Assessment is a certain percentage of the fair market value that is determined by local assessors to be the total taxable value of land and additions on the property. | Land | Improvement |
|---|---|---|---|---|
| 2025 | $7,308 | $128,590 | $29,750 | $98,840 |
| 2024 | $7,308 | $128,590 | $29,750 | $98,840 |
| 2023 | $7,264 | $128,590 | $29,750 | $98,840 |
| 2022 | $6,117 | $82,430 | $19,990 | $62,440 |
| 2021 | $6,167 | $82,430 | $19,990 | $62,440 |
| 2020 | $6,150 | $82,430 | $19,990 | $62,440 |
| 2019 | $5,590 | $70,600 | $19,990 | $50,610 |
| 2018 | $5,438 | $70,600 | $19,990 | $50,610 |
| 2017 | $5,388 | $70,600 | $19,990 | $50,610 |
| 2016 | $5,684 | $67,800 | $19,530 | $48,270 |
| 2015 | $5,505 | $67,800 | $19,530 | $48,270 |
| 2014 | $5,510 | $67,800 | $19,530 | $48,270 |
| 2013 | $2,751 | $67,795 | $19,530 | $48,265 |
Source: Public Records
Map
Nearby Homes
- 256 Spring Hollow Ln
- 91 Haddam Place E
- 150 Hanby Ave
- 8251 Tegmen St Unit 209
- 8302 Mira St Unit 148
- 7852 Heathcock Ct
- 8307 Tegmen St Unit 223
- 111 Groton Dr Unit 113
- 8133 Worthington Crossing Dr
- 144 Brandywine Dr Unit C
- 1212 Tillicum Dr
- 696 Tree Bend Ct
- 8240 Worthington Crossing Dr
- 711 Lazelle Rd
- 1073 Discovery Dr
- 8378 Greyhawk Cir Unit 8378
- 7921 Chetenham Dr
- 994 Annagladys Dr Unit M4
- 321 Pinnate Ln Unit Lot 1504
- 327 Pinnate Ln Unit Lot 1502
- 58 Ormsbee Ave
- 44 Ormsbee Ave
- 909 Danvers Ave
- 64 Ormsbee Ave
- 927 Danvers Ave
- 1118 Arundel Ave
- 53 Ormsbee Ave
- 935 Danvers Ave
- 47 Ormsbee Ave
- 892 Danvers Ave
- 900 Danvers Ave
- 63 Ormsbee Ave
- 43 Ormsbee Ave
- 908 Danvers Ave
- 1114 Arundel Ave
- 943 Danvers Ave
- 916 Danvers Ave
- 37 Ormsbee Ave
- 71 Ormsbee Ave
- 1123 Arundel Ave
Your Personal Tour Guide
Ask me questions while you tour the home.