Estimated Value: $302,000 - $339,000
4
Beds
4
Baths
1,556
Sq Ft
$206/Sq Ft
Est. Value
About This Home
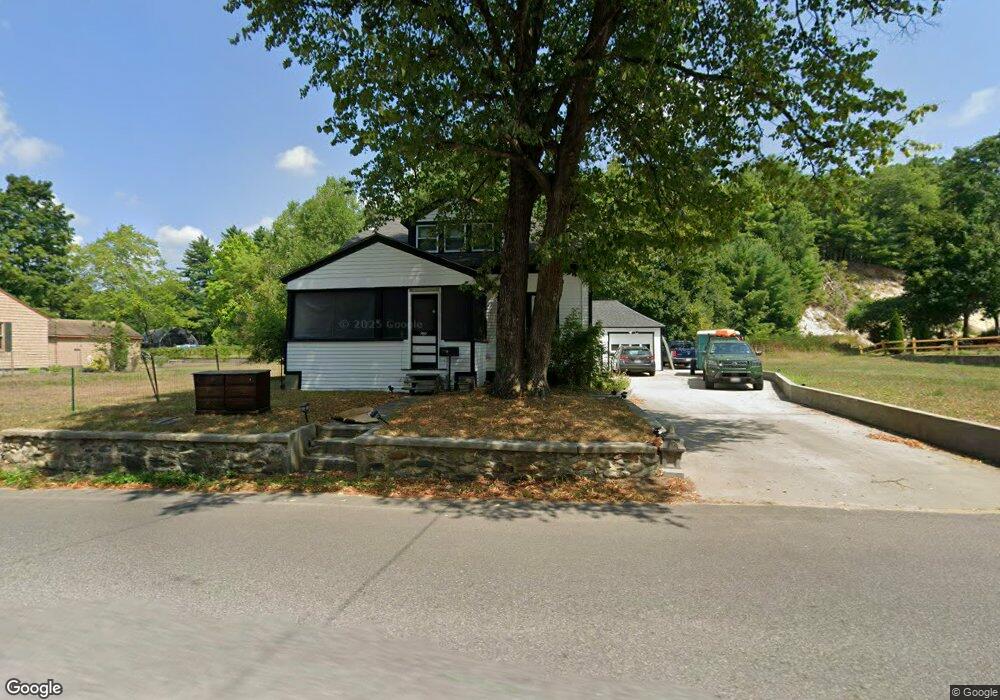
This home is located at 50 Pequoig Ave, Athol, MA 01331 and is currently estimated at $320,036, approximately $205 per square foot. 50 Pequoig Ave is a home located in Worcester County with nearby schools including Athol High School.
Ownership History
Date
Name
Owned For
Owner Type
Purchase Details
Closed on
Dec 14, 2023
Sold by
Johnson April and Ivins Thomas
Bought by
Ipock Colleen
Current Estimated Value
Home Financials for this Owner
Home Financials are based on the most recent Mortgage that was taken out on this home.
Original Mortgage
$150,000
Outstanding Balance
$147,389
Interest Rate
7.76%
Mortgage Type
Purchase Money Mortgage
Estimated Equity
$172,647
Purchase Details
Closed on
Apr 12, 2021
Sold by
Ivins Theresa J
Bought by
Ipock Colleen and Johnson April
Purchase Details
Closed on
Oct 6, 1978
Bought by
Ivins Alonzo E
Create a Home Valuation Report for This Property
The Home Valuation Report is an in-depth analysis detailing your home's value as well as a comparison with similar homes in the area
Home Values in the Area
Average Home Value in this Area
Purchase History
| Date | Buyer | Sale Price | Title Company |
|---|---|---|---|
| Ipock Colleen | $80,000 | None Available | |
| Ipock Colleen | -- | None Available | |
| Ivins Alonzo E | -- | -- |
Source: Public Records
Mortgage History
| Date | Status | Borrower | Loan Amount |
|---|---|---|---|
| Open | Ipock Colleen | $150,000 |
Source: Public Records
Tax History Compared to Growth
Tax History
| Year | Tax Paid | Tax Assessment Tax Assessment Total Assessment is a certain percentage of the fair market value that is determined by local assessors to be the total taxable value of land and additions on the property. | Land | Improvement |
|---|---|---|---|---|
| 2025 | $3,231 | $254,200 | $50,700 | $203,500 |
| 2024 | $3,128 | $243,800 | $50,700 | $193,100 |
| 2023 | $3,000 | $213,700 | $36,800 | $176,900 |
| 2022 | $2,889 | $180,000 | $35,000 | $145,000 |
| 2021 | $2,343 | $132,700 | $31,900 | $100,800 |
| 2020 | $2,218 | $129,100 | $29,000 | $100,100 |
| 2019 | $1,937 | $111,000 | $27,400 | $83,600 |
| 2018 | $2,141 | $109,400 | $24,900 | $84,500 |
| 2017 | $1,989 | $97,500 | $24,900 | $72,600 |
| 2016 | $1,850 | $93,300 | $24,900 | $68,400 |
| 2015 | $1,775 | $93,300 | $24,900 | $68,400 |
| 2014 | $1,720 | $93,300 | $24,900 | $68,400 |
Source: Public Records
Map
Nearby Homes
- 2 Pequoig Ave
- 82 Pequoig Ave
- 75 Pequoig Ave
- 17 Pinedale Ave
- 03 Pinedale Ave
- 96 Pequoig Ave
- 87 Pequoig Ave
- 101 Pequoig Ave
- 61 Pinedale Ave
- 120 Pequoig Ave
- 107 Stevens St
- 80 Stevens St
- 149 Pequoig Ave
- 89 Stevens St
- 64 Stevens St
- 77 Stevens St
- 50 Stevens St
- 159 Pequoig Ave
- 89 Pinedale Ave
- 6 Wallingford Ave