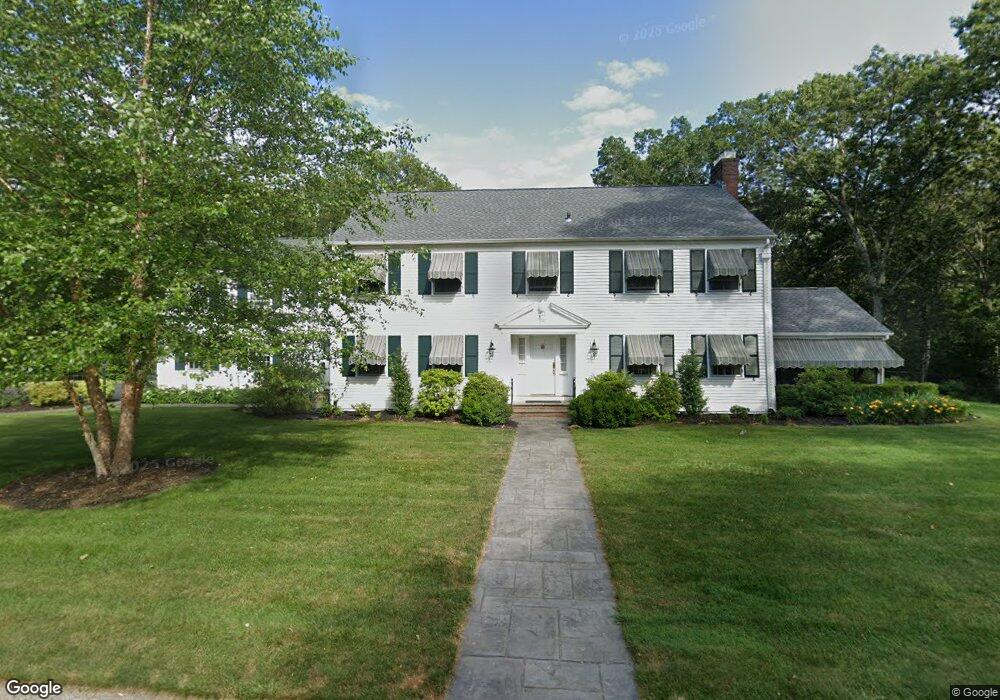
50 Pequot Rd Pawtucket, RI 02861
Darlington NeighborhoodEstimated Value: $706,000 - $1,025,000
4
Beds
4
Baths
4,073
Sq Ft
$209/Sq Ft
Est. Value
About This Home
This home is located at 50 Pequot Rd, Pawtucket, RI 02861 and is currently estimated at $850,156, approximately $208 per square foot. 50 Pequot Rd is a home located in Providence County with nearby schools including St Cecilia School and Saint Teresa Catholic Elementary School.
Ownership History
Date
Name
Owned For
Owner Type
Purchase Details
Closed on
Oct 8, 2024
Sold by
Tarpy Peter E
Bought by
Peter E Tarpy Declara T E and Peter Tarpy
Current Estimated Value
Purchase Details
Closed on
Apr 14, 2022
Sold by
Tarpy Patricia A
Bought by
Patricia Lt and Tarpy
Purchase Details
Closed on
Sep 6, 2011
Sold by
Hines Susan T and Tarpy Peter E
Bought by
Tarpy Patricia A and Tarpy Peter E
Create a Home Valuation Report for This Property
The Home Valuation Report is an in-depth analysis detailing your home's value as well as a comparison with similar homes in the area
Home Values in the Area
Average Home Value in this Area
Purchase History
| Date | Buyer | Sale Price | Title Company |
|---|---|---|---|
| Peter E Tarpy Declara T E | -- | None Available | |
| Peter E Tarpy Declara T E | -- | None Available | |
| Patricia Lt | -- | None Available | |
| Patricia Lt | -- | None Available | |
| Tarpy Patricia A | -- | -- | |
| Tarpy Peter E | -- | -- | |
| Tarpy Patricia A | -- | -- |
Source: Public Records
Tax History Compared to Growth
Tax History
| Year | Tax Paid | Tax Assessment Tax Assessment Total Assessment is a certain percentage of the fair market value that is determined by local assessors to be the total taxable value of land and additions on the property. | Land | Improvement |
|---|---|---|---|---|
| 2025 | $8,738 | $664,500 | $149,500 | $515,000 |
| 2024 | $8,200 | $664,500 | $149,500 | $515,000 |
| 2023 | $10,325 | $609,500 | $114,300 | $495,200 |
| 2022 | $9,960 | $600,700 | $114,300 | $486,400 |
| 2021 | $9,960 | $600,700 | $114,300 | $486,400 |
| 2020 | $9,572 | $458,200 | $107,200 | $351,000 |
| 2019 | $9,572 | $458,200 | $107,200 | $351,000 |
| 2018 | $9,224 | $458,200 | $107,200 | $351,000 |
| 2017 | $10,224 | $450,000 | $111,200 | $338,800 |
| 2016 | $9,851 | $450,000 | $111,200 | $338,800 |
| 2015 | $9,851 | $450,000 | $111,200 | $338,800 |
| 2014 | $9,743 | $422,500 | $97,300 | $325,200 |
Source: Public Records
Map
Nearby Homes