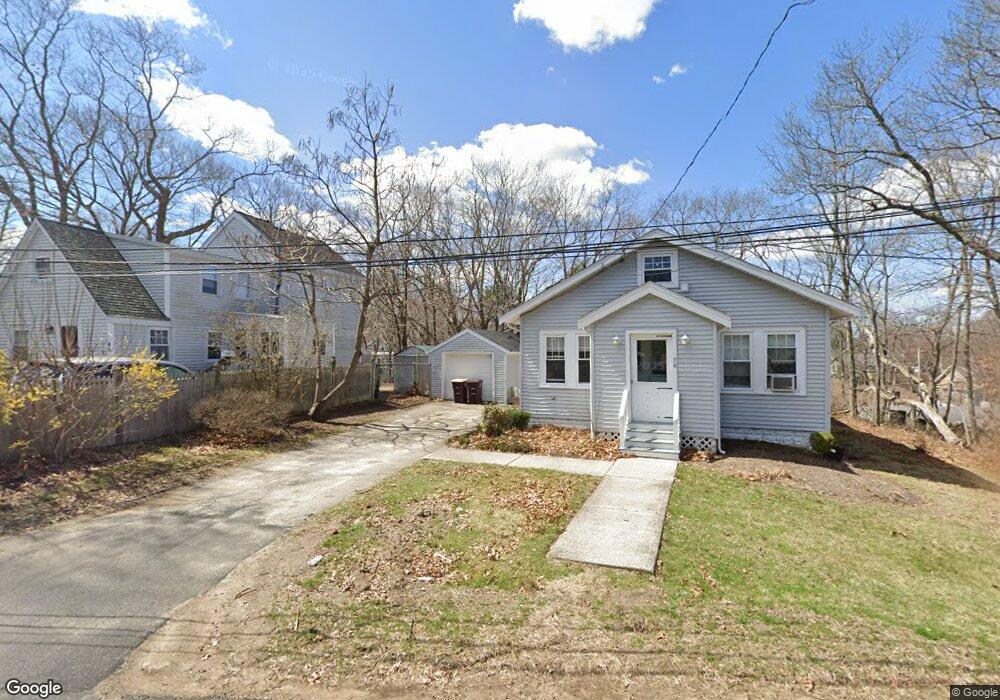
50 Pierce Rd Weymouth, MA 02188
Weymouth Landing NeighborhoodEstimated Value: $511,951 - $764,000
Studio
1
Bath
1,560
Sq Ft
$391/Sq Ft
Est. Value
About This Home
This home is located at 50 Pierce Rd, Weymouth, MA 02188 and is currently estimated at $609,238, approximately $390 per square foot. 50 Pierce Rd is a home located in Norfolk County with nearby schools including Abigail Adams Middle School, Frederick C Murphy, and Weymouth Middle School Chapman.
Ownership History
Date
Name
Owned For
Owner Type
Purchase Details
Closed on
Apr 14, 2000
Sold by
Shipp John S and Shipp Lisa J
Bought by
Quincy Nghbrhd Hsng
Current Estimated Value
Purchase Details
Closed on
Oct 23, 1996
Sold by
Collins Ex Martha J
Bought by
Shipp John S and Shipp Lisa J
Create a Home Valuation Report for This Property
The Home Valuation Report is an in-depth analysis detailing your home's value as well as a comparison with similar homes in the area
Home Values in the Area
Average Home Value in this Area
Purchase History
| Date | Buyer | Sale Price | Title Company |
|---|---|---|---|
| Quincy Nghbrhd Hsng | $166,000 | -- | |
| Shipp John S | $115,000 | -- |
Source: Public Records
Mortgage History
| Date | Status | Borrower | Loan Amount |
|---|---|---|---|
| Open | Shipp John S | $14,000 | |
| Open | Shipp John S | $180,000 | |
| Previous Owner | Shipp John S | $125,401 | |
| Previous Owner | Shipp John S | $118,430 |
Source: Public Records
Tax History Compared to Growth
Tax History
| Year | Tax Paid | Tax Assessment Tax Assessment Total Assessment is a certain percentage of the fair market value that is determined by local assessors to be the total taxable value of land and additions on the property. | Land | Improvement |
|---|---|---|---|---|
| 2025 | $3,712 | $367,500 | $229,000 | $138,500 |
| 2024 | $3,599 | $350,400 | $218,100 | $132,300 |
| 2023 | $3,393 | $324,700 | $201,900 | $122,800 |
| 2022 | $4,723 | $412,100 | $187,000 | $225,100 |
| 2021 | $4,390 | $373,900 | $187,000 | $186,900 |
| 2020 | $4,218 | $353,900 | $187,000 | $166,900 |
| 2019 | $4,053 | $334,400 | $179,800 | $154,600 |
| 2018 | $3,936 | $314,900 | $171,200 | $143,700 |
| 2017 | $3,375 | $263,500 | $163,100 | $100,400 |
| 2016 | $3,296 | $257,500 | $156,800 | $100,700 |
| 2015 | $3,167 | $245,500 | $149,700 | $95,800 |
| 2014 | $3,086 | $232,000 | $139,300 | $92,700 |
Source: Public Records
Map
Nearby Homes
- 114 Broad St Unit D
- 19 Vine St Unit 3
- 19 Vine St Unit 1
- 11 Richmond St
- 16 Lindbergh Ave
- 12 Franklin St
- 286 Broad St
- 12 Klasson Ln
- 15 Summer St
- 33 Congress St
- 116 Gordon Rd
- 286 Essex St
- 38 Idlewell St
- 141 Commercial St Unit 9
- 16 Beechwood Rd
- 37 Lantern Ln
- 41 Lantern Ln
- 107 Summer St
- 145 Jaffrey St
- 125 Allen St Unit A