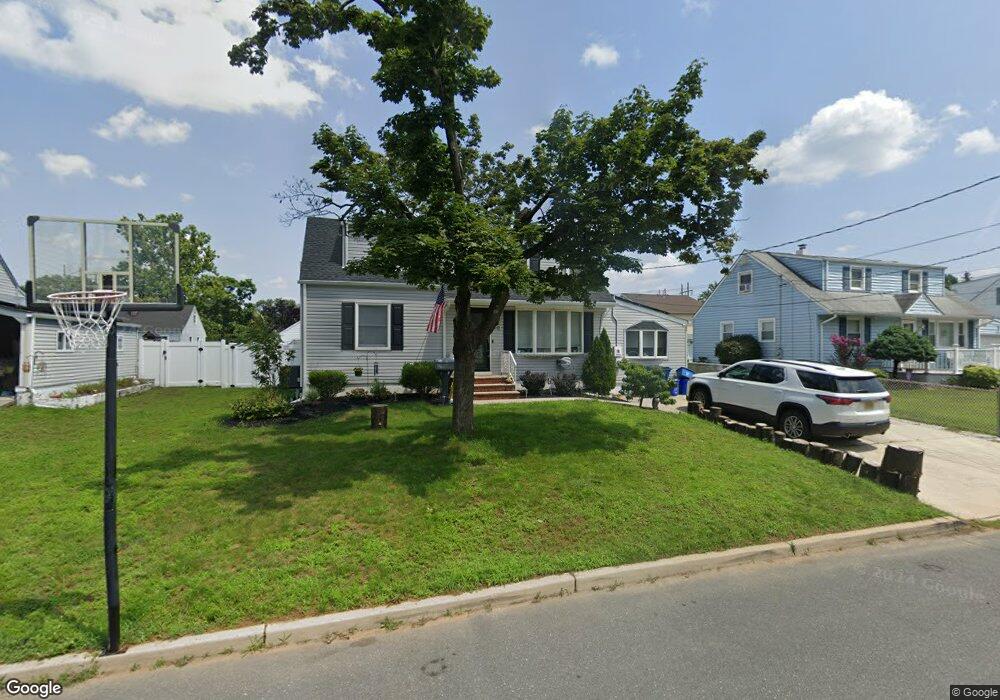
50 Piersoll Rd Old Bridge, NJ 08857
Estimated Value: $552,000 - $676,000
3
Beds
2
Baths
2,141
Sq Ft
$285/Sq Ft
Est. Value
About This Home
This home is located at 50 Piersoll Rd, Old Bridge, NJ 08857 and is currently estimated at $610,042, approximately $284 per square foot. 50 Piersoll Rd is a home located in Middlesex County with nearby schools including Old Bridge High School, St. Thomas the Apostle School, and Immaculate Conception School.
Ownership History
Date
Name
Owned For
Owner Type
Purchase Details
Closed on
Oct 5, 2007
Sold by
French Mark and French Tara L
Bought by
Manning John and Manning Dawn
Current Estimated Value
Home Financials for this Owner
Home Financials are based on the most recent Mortgage that was taken out on this home.
Original Mortgage
$36,500
Outstanding Balance
$29,998
Interest Rate
6.51%
Mortgage Type
Credit Line Revolving
Estimated Equity
$580,044
Purchase Details
Closed on
Jun 1, 1998
Sold by
Ogrodowczyk Raymond
Bought by
French Mark and Napp Bernadette
Home Financials for this Owner
Home Financials are based on the most recent Mortgage that was taken out on this home.
Original Mortgage
$118,400
Interest Rate
6.98%
Create a Home Valuation Report for This Property
The Home Valuation Report is an in-depth analysis detailing your home's value as well as a comparison with similar homes in the area
Home Values in the Area
Average Home Value in this Area
Purchase History
| Date | Buyer | Sale Price | Title Company |
|---|---|---|---|
| Manning John | $365,000 | Shepherd Title | |
| French Mark | $148,000 | -- |
Source: Public Records
Mortgage History
| Date | Status | Borrower | Loan Amount |
|---|---|---|---|
| Open | Manning John | $36,500 | |
| Open | Manning John | $292,000 | |
| Previous Owner | French Mark | $118,400 |
Source: Public Records
Tax History Compared to Growth
Tax History
| Year | Tax Paid | Tax Assessment Tax Assessment Total Assessment is a certain percentage of the fair market value that is determined by local assessors to be the total taxable value of land and additions on the property. | Land | Improvement |
|---|---|---|---|---|
| 2025 | $7,940 | $140,600 | $45,300 | $95,300 |
| 2024 | $7,616 | $140,600 | $45,300 | $95,300 |
| 2023 | $7,616 | $140,600 | $45,300 | $95,300 |
| 2022 | $7,442 | $140,600 | $45,300 | $95,300 |
| 2021 | $5,462 | $140,600 | $45,300 | $95,300 |
| 2020 | $7,223 | $140,600 | $45,300 | $95,300 |
| 2019 | $7,100 | $140,600 | $45,300 | $95,300 |
| 2018 | $7,022 | $140,600 | $45,300 | $95,300 |
| 2017 | $6,794 | $140,600 | $45,300 | $95,300 |
| 2016 | $6,653 | $140,600 | $45,300 | $95,300 |
| 2015 | $6,538 | $140,600 | $45,300 | $95,300 |
| 2014 | $6,472 | $140,600 | $45,300 | $95,300 |
Source: Public Records
Map
Nearby Homes