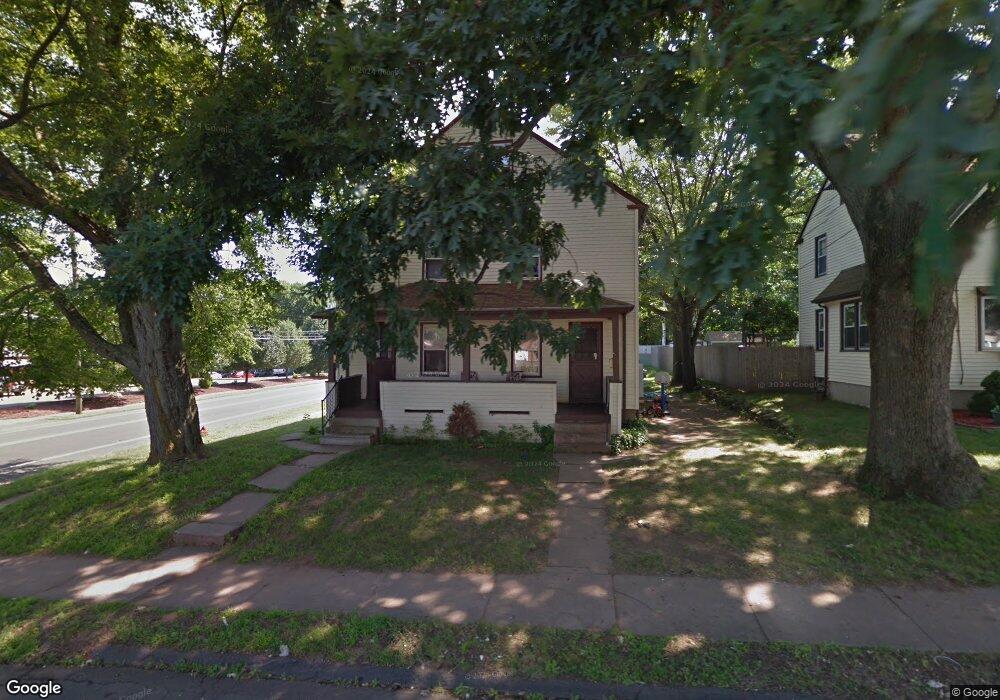
50 Pine St Unit 52 East Hartford, CT 06108
Estimated Value: $290,546 - $390,000
4
Beds
2
Baths
2,316
Sq Ft
$141/Sq Ft
Est. Value
About This Home
This home is located at 50 Pine St Unit 52, East Hartford, CT 06108 and is currently estimated at $327,137, approximately $141 per square foot. 50 Pine St Unit 52 is a home located in Hartford County with nearby schools including Dr. Franklin H. Mayberry School, East Hartford Middle School, and East Hartford High School.
Ownership History
Date
Name
Owned For
Owner Type
Purchase Details
Closed on
Jul 19, 2000
Sold by
Thatcher David W and Thatcher Susan D
Bought by
Washington Tanya and Mitchell Shamika
Current Estimated Value
Home Financials for this Owner
Home Financials are based on the most recent Mortgage that was taken out on this home.
Original Mortgage
$119,019
Interest Rate
8.28%
Create a Home Valuation Report for This Property
The Home Valuation Report is an in-depth analysis detailing your home's value as well as a comparison with similar homes in the area
Home Values in the Area
Average Home Value in this Area
Purchase History
| Date | Buyer | Sale Price | Title Company |
|---|---|---|---|
| Washington Tanya | $120,000 | -- |
Source: Public Records
Mortgage History
| Date | Status | Borrower | Loan Amount |
|---|---|---|---|
| Open | Washington Tanya | $188,000 | |
| Closed | Washington Tanya | $123,150 | |
| Closed | Washington Tanya | $120,200 | |
| Closed | Washington Tanya | $119,019 |
Source: Public Records
Tax History Compared to Growth
Tax History
| Year | Tax Paid | Tax Assessment Tax Assessment Total Assessment is a certain percentage of the fair market value that is determined by local assessors to be the total taxable value of land and additions on the property. | Land | Improvement |
|---|---|---|---|---|
| 2025 | $7,036 | $153,300 | $27,780 | $125,520 |
| 2024 | $6,745 | $153,300 | $27,780 | $125,520 |
| 2023 | $6,521 | $153,300 | $27,780 | $125,520 |
| 2022 | $6,285 | $153,300 | $27,780 | $125,520 |
| 2021 | $5,580 | $113,060 | $21,050 | $92,010 |
| 2020 | $5,644 | $113,060 | $21,050 | $92,010 |
| 2019 | $5,552 | $113,060 | $21,050 | $92,010 |
| 2018 | $5,388 | $113,060 | $21,050 | $92,010 |
| 2017 | $5,319 | $113,060 | $21,050 | $92,010 |
| 2016 | $5,361 | $116,910 | $21,050 | $95,860 |
| 2015 | $5,173 | $112,800 | $21,050 | $91,750 |
| 2014 | $5,121 | $112,800 | $21,050 | $91,750 |
Source: Public Records
Map
Nearby Homes
- 73 Bliss St
- 8 Howard Ct Unit 10
- 26 Casabella Cir Unit 28
- 59 Laraia Ave
- 40 Larrabee St
- 0 Hillside Ave
- 61 Leverich Dr
- 952 Tolland St
- 71 Higbie Dr Unit 73
- 421 Tolland St
- 421 Tolland St Unit 209
- 577 Goodwin St
- 22 Matthew Rd
- 89 Henderson Dr
- 345 Goodwin St
- 21 Highview St
- 15 Michael Ave
- 509 Burnside Ave Unit A18
- 506 Burnside Ave
- 53 Arbutus St