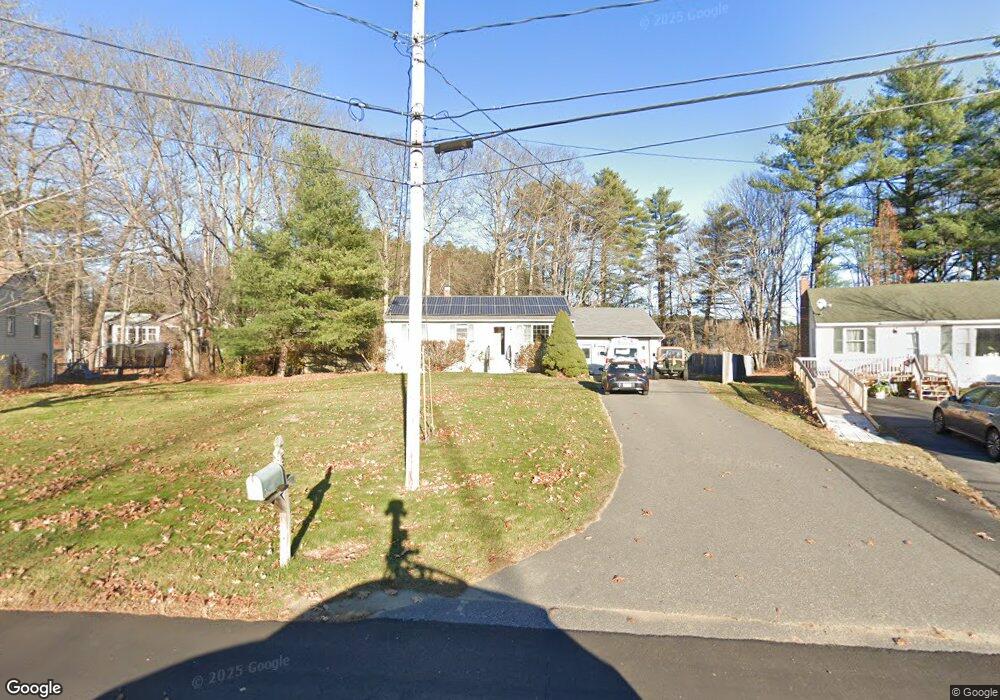
50 Pinewood Dr Topsham, ME 04086
Estimated Value: $410,000 - $582,000
2
Beds
2
Baths
1,192
Sq Ft
$382/Sq Ft
Est. Value
About This Home
This home is located at 50 Pinewood Dr, Topsham, ME 04086 and is currently estimated at $455,020, approximately $381 per square foot. 50 Pinewood Dr is a home located in Sagadahoc County with nearby schools including Mt Ararat High School, Harpswell Coastal Academy Divisions 2 and 3, and St. John's Catholic School.
Ownership History
Date
Name
Owned For
Owner Type
Purchase Details
Closed on
May 16, 2014
Sold by
Sargent Gregory J and Sargent Karrie L
Bought by
Sea & Ski Llc
Current Estimated Value
Purchase Details
Closed on
Apr 2, 2013
Sold by
Burton Leslie E
Bought by
Sargent Gregory J and Sargent Karrie L
Home Financials for this Owner
Home Financials are based on the most recent Mortgage that was taken out on this home.
Original Mortgage
$130,400
Interest Rate
3.56%
Mortgage Type
New Conventional
Create a Home Valuation Report for This Property
The Home Valuation Report is an in-depth analysis detailing your home's value as well as a comparison with similar homes in the area
Home Values in the Area
Average Home Value in this Area
Purchase History
| Date | Buyer | Sale Price | Title Company |
|---|---|---|---|
| Sea & Ski Llc | -- | -- | |
| Sargent Gregory J | -- | -- |
Source: Public Records
Mortgage History
| Date | Status | Borrower | Loan Amount |
|---|---|---|---|
| Previous Owner | Sargent Gregory J | $130,400 |
Source: Public Records
Tax History Compared to Growth
Tax History
| Year | Tax Paid | Tax Assessment Tax Assessment Total Assessment is a certain percentage of the fair market value that is determined by local assessors to be the total taxable value of land and additions on the property. | Land | Improvement |
|---|---|---|---|---|
| 2025 | $4,294 | $335,500 | $59,300 | $276,200 |
| 2024 | $4,173 | $333,800 | $55,000 | $278,800 |
| 2023 | $3,933 | $289,600 | $52,300 | $237,300 |
| 2022 | $3,591 | $249,000 | $50,600 | $198,400 |
| 2021 | $3,576 | $225,300 | $46,400 | $178,900 |
| 2020 | $3,445 | $192,900 | $46,400 | $146,500 |
| 2019 | $3,470 | $181,200 | $46,400 | $134,800 |
| 2018 | $3,094 | $165,200 | $41,500 | $123,700 |
| 2017 | $2,993 | $165,200 | $41,500 | $123,700 |
| 2016 | $2,990 | $166,200 | $41,500 | $124,700 |
| 2015 | $2,872 | $159,900 | $41,500 | $118,400 |
| 2014 | $2,747 | $158,500 | $41,500 | $117,000 |
| 2013 | $2,639 | $158,500 | $41,500 | $117,000 |
Source: Public Records
Map
Nearby Homes