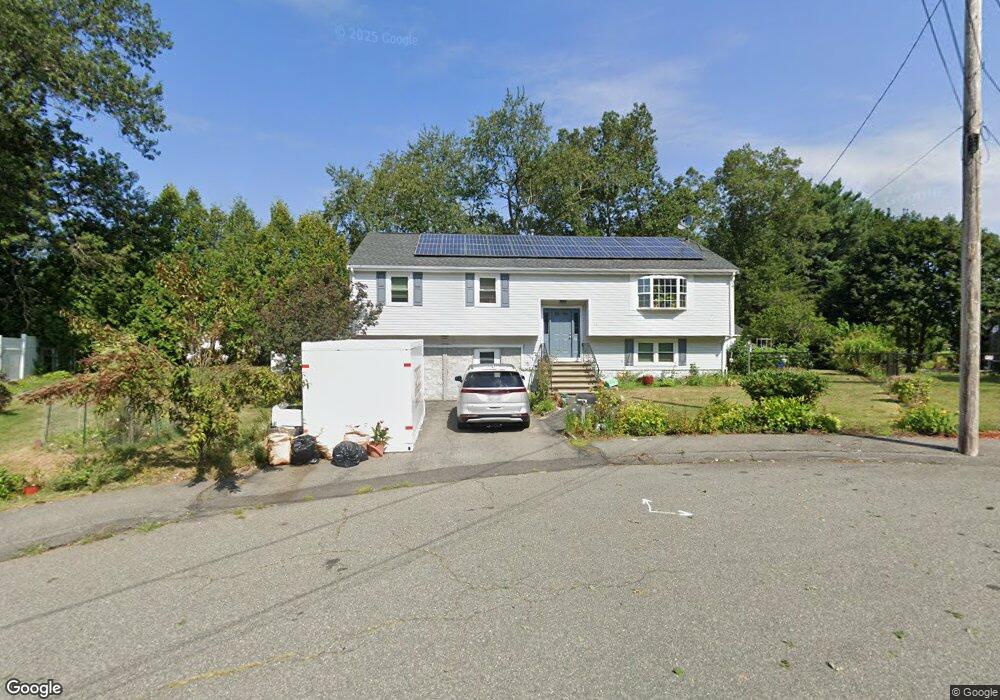
50 Prospect Ave Randolph, MA 02368
Downtown Randolph NeighborhoodEstimated Value: $660,000 - $673,000
3
Beds
3
Baths
1,388
Sq Ft
$480/Sq Ft
Est. Value
About This Home
This home is located at 50 Prospect Ave, Randolph, MA 02368 and is currently estimated at $666,924, approximately $480 per square foot. 50 Prospect Ave is a home located in Norfolk County with nearby schools including Randolph High School, Boston Higashi School, and Lighthouse Baptist Christian Academy.
Ownership History
Date
Name
Owned For
Owner Type
Purchase Details
Closed on
Sep 30, 2025
Sold by
Blake Ruby
Bought by
Hampton Carlotta
Current Estimated Value
Purchase Details
Closed on
Apr 10, 2008
Sold by
Blake Ruby
Bought by
Blake Ruby and Hampton Carlotta M
Purchase Details
Closed on
Aug 5, 2005
Sold by
Kwok Edwin and Kwok Elaine
Bought by
Blake Ruby
Home Financials for this Owner
Home Financials are based on the most recent Mortgage that was taken out on this home.
Original Mortgage
$344,000
Interest Rate
5.63%
Mortgage Type
Purchase Money Mortgage
Purchase Details
Closed on
Apr 16, 1998
Sold by
West Point Dev Co Inc
Bought by
Kwok Edwin and Kwok Pui J
Home Financials for this Owner
Home Financials are based on the most recent Mortgage that was taken out on this home.
Original Mortgage
$120,000
Interest Rate
7.11%
Mortgage Type
Purchase Money Mortgage
Create a Home Valuation Report for This Property
The Home Valuation Report is an in-depth analysis detailing your home's value as well as a comparison with similar homes in the area
Home Values in the Area
Average Home Value in this Area
Purchase History
We collect this data history from publicly available records. To have your information removed, we recommend requesting removal directly through your county’s website.
| Date | Buyer | Sale Price | Title Company |
|---|---|---|---|
| Hampton Carlotta | -- | -- | |
| Blake Ruby | -- | -- | |
| Blake Ruby | -- | -- | |
| Blake Ruby | -- | -- | |
| Blake Ruby | $430,000 | -- | |
| Blake Ruby | $430,000 | -- | |
| Kwok Edwin | $175,182 | -- | |
| Kwok Edwin | $175,182 | -- |
Source: Public Records
Mortgage History
We collect this data history from publicly available records. To have your information removed, we recommend requesting removal directly through your county’s website.
| Date | Status | Borrower | Loan Amount |
|---|---|---|---|
| Previous Owner | Blake Ruby | $344,000 | |
| Previous Owner | Kwok Edwin | $120,000 | |
| Previous Owner | Kwok Edwin | $120,000 |
Source: Public Records
Tax History
| Year | Tax Paid | Tax Assessment Tax Assessment Total Assessment is a certain percentage of the fair market value that is determined by local assessors to be the total taxable value of land and additions on the property. | Land | Improvement |
|---|---|---|---|---|
| 2025 | $7,112 | $612,600 | $260,100 | $352,500 |
| 2024 | $6,973 | $609,000 | $255,000 | $354,000 |
| 2023 | $6,791 | $562,200 | $231,900 | $330,300 |
| 2022 | $6,540 | $480,900 | $193,200 | $287,700 |
| 2021 | $6,313 | $427,100 | $161,000 | $266,100 |
| 2020 | $6,131 | $411,200 | $161,000 | $250,200 |
| 2019 | $6,044 | $403,500 | $153,300 | $250,200 |
| 2018 | $5,925 | $373,100 | $139,400 | $233,700 |
| 2017 | $5,710 | $352,900 | $132,700 | $220,200 |
| 2016 | $5,567 | $320,100 | $120,800 | $199,300 |
| 2015 | $5,443 | $300,700 | $114,900 | $185,800 |
Source: Public Records
Map
Nearby Homes
- 249 Mill St
- 89 Fernandez Cir
- 143 South St
- 64 North St
- 41 Maple St
- 25 Lakeview Ave
- 12 Darrell Dr
- 117 S Main St
- 35 Pearl St Unit 35
- 5 Clarendon Cir Unit Lot 4
- 20 Fairmount St
- 25 Gloversbrook Rd
- 156 Allen St
- 301 Highland Ave
- 38 Druid Hill Ave E
- 7 Platts St
- 24 Nelson Dr Unit 2D
- 15 Jefferson Rd
- 20 Jasper Ln
- 42 Jasper Ln Unit 42
Your Personal Tour Guide
Ask me questions while you tour the home.