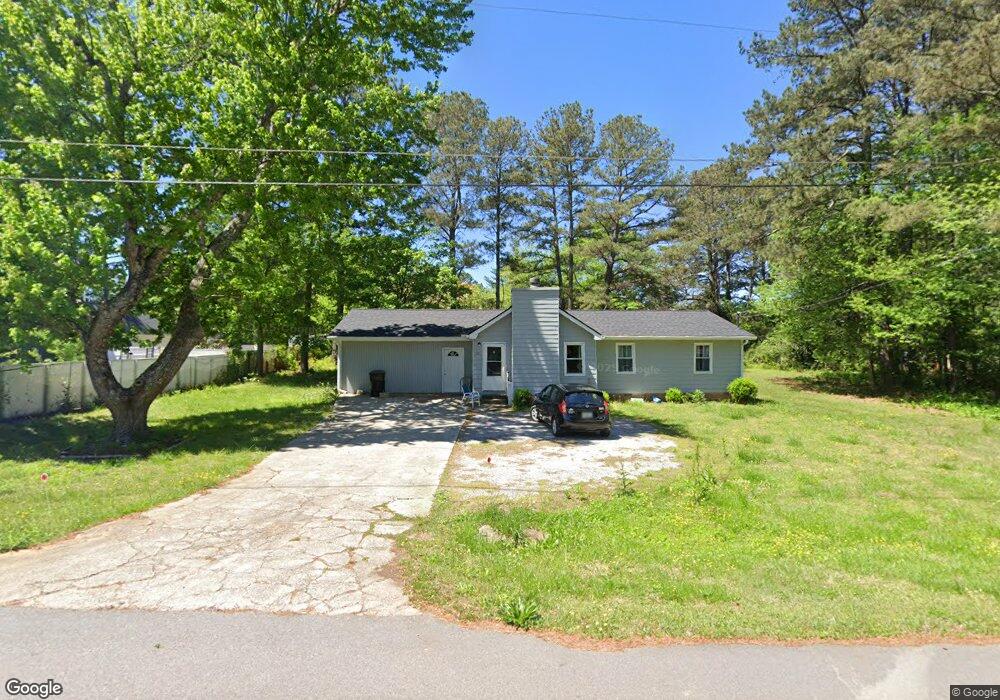
50 Rose St Carrollton, GA 30116
Abilene NeighborhoodEstimated Value: $222,792 - $243,000
3
Beds
2
Baths
1,433
Sq Ft
$163/Sq Ft
Est. Value
About This Home
This home is located at 50 Rose St, Carrollton, GA 30116 and is currently estimated at $233,198, approximately $162 per square foot. 50 Rose St is a home located in Carroll County with nearby schools including Sharp Creek Elementary School, Bay Springs Middle School, and Villa Rica High School.
Ownership History
Date
Name
Owned For
Owner Type
Purchase Details
Closed on
Mar 22, 2011
Sold by
Federal Home Loan Mortgage Corporation
Bought by
Hastings-Storer Jill M
Current Estimated Value
Purchase Details
Closed on
Dec 7, 2010
Sold by
Aurora Loan Svcs Llc
Bought by
Federal Home Loan Mortgage Corporation
Purchase Details
Closed on
Jun 6, 2003
Sold by
Secretary Of Hud
Bought by
Jones Alphonso M
Purchase Details
Closed on
Feb 4, 2003
Sold by
Ba Mortgage Llc
Bought by
Secretary Of Hud
Purchase Details
Closed on
Mar 13, 1998
Sold by
Secretary Of Hud
Bought by
Wright Leasa Hogan
Purchase Details
Closed on
Sep 2, 1997
Sold by
Principal Residentia
Bought by
Secretary Of Hud
Purchase Details
Closed on
Jun 17, 1994
Sold by
Sims Wm
Bought by
Boykin Derek L
Purchase Details
Closed on
Jul 20, 1993
Sold by
Sec Of Hud
Bought by
Sims Wm
Create a Home Valuation Report for This Property
The Home Valuation Report is an in-depth analysis detailing your home's value as well as a comparison with similar homes in the area
Home Values in the Area
Average Home Value in this Area
Purchase History
| Date | Buyer | Sale Price | Title Company |
|---|---|---|---|
| Hastings-Storer Jill M | $25,500 | -- | |
| Federal Home Loan Mortgage Corporation | $27,786 | -- | |
| Aurora Loan Svcs Llc | $27,786 | -- | |
| Jones Alphonso M | -- | -- | |
| Secretary Of Hud | -- | -- | |
| Ba Mortgage Llc | -- | -- | |
| Wright Leasa Hogan | $74,500 | -- | |
| Secretary Of Hud | $61,900 | -- | |
| Principal Residentia | $61,900 | -- | |
| Boykin Derek L | $59,900 | -- | |
| Sims Wm | $37,200 | -- |
Source: Public Records
Tax History Compared to Growth
Tax History
| Year | Tax Paid | Tax Assessment Tax Assessment Total Assessment is a certain percentage of the fair market value that is determined by local assessors to be the total taxable value of land and additions on the property. | Land | Improvement |
|---|---|---|---|---|
| 2024 | $378 | $67,426 | $4,000 | $63,426 |
| 2023 | $378 | $61,747 | $4,000 | $57,747 |
| 2022 | $1,262 | $50,307 | $4,000 | $46,307 |
| 2021 | $1,122 | $43,784 | $4,000 | $39,784 |
| 2020 | $1,021 | $39,781 | $4,000 | $35,781 |
| 2019 | $959 | $37,054 | $4,000 | $33,054 |
| 2018 | $641 | $24,426 | $3,000 | $21,426 |
| 2017 | $643 | $24,426 | $3,000 | $21,426 |
| 2016 | $644 | $24,426 | $3,000 | $21,426 |
| 2015 | $793 | $28,359 | $6,000 | $22,359 |
| 2014 | $796 | $28,359 | $6,000 | $22,359 |
Source: Public Records
Map
Nearby Homes
- 0 Knight Dr W
- 0 Shady Grove Rd Unit 10601173
- 0 Shady Grove Rd Unit 10601172
- 1890 Shady Grove Rd
- 0 Old Airport Rd Unit 10599783
- 0 Old Airport Rd Unit 7642336
- 0 Old Airport Rd Unit 10599779
- The McGinnis Plan at Morgan Landing
- 255 Emerald Pointe Dr
- 255 Morgan Rd
- 221 Turtle Cove
- 211 Greystone Dr
- 131 Hunter Way
- 105 Providence Ct
- 2580 Shady Grove Rd
- 00 Old Airport Rd
- 201 Deerfield Ln
- 0 Frashier Rd Unit 7549781
- 0 Frashier Rd Unit 10488685
- 115 N Lake Dr