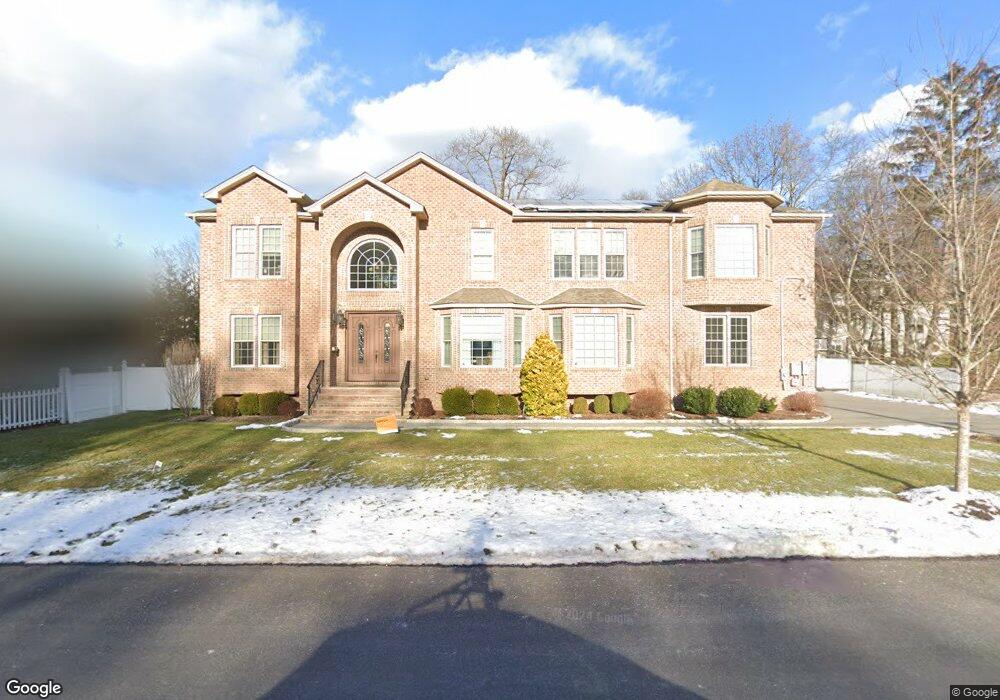
50 Ross Ave Demarest, NJ 07627
Estimated Value: $2,112,000 - $2,208,241
Studio
--
Bath
3,894
Sq Ft
$551/Sq Ft
Est. Value
About This Home
This home is located at 50 Ross Ave, Demarest, NJ 07627 and is currently estimated at $2,145,310, approximately $550 per square foot. 50 Ross Ave is a home located in Bergen County with nearby schools including County Road Elementary School, Demarest Middle School, and Luther Lee Emerson Elementary School.
Ownership History
Date
Name
Owned For
Owner Type
Purchase Details
Closed on
May 29, 2012
Sold by
Nj North Properties Ii Llc
Bought by
Braff Nelson and Braff Stacey
Current Estimated Value
Home Financials for this Owner
Home Financials are based on the most recent Mortgage that was taken out on this home.
Original Mortgage
$625,000
Outstanding Balance
$433,553
Interest Rate
3.85%
Mortgage Type
New Conventional
Estimated Equity
$1,711,757
Purchase Details
Closed on
Oct 21, 2011
Sold by
Fidler Constance M
Bought by
Nj North Properties Llc
Create a Home Valuation Report for This Property
The Home Valuation Report is an in-depth analysis detailing your home's value as well as a comparison with similar homes in the area
Home Values in the Area
Average Home Value in this Area
Purchase History
| Date | Buyer | Sale Price | Title Company |
|---|---|---|---|
| Braff Nelson | $1,190,000 | -- | |
| Nj North Properties Llc | $450,000 | -- |
Source: Public Records
Mortgage History
| Date | Status | Borrower | Loan Amount |
|---|---|---|---|
| Open | Braff Nelson | $625,000 |
Source: Public Records
Tax History
| Year | Tax Paid | Tax Assessment Tax Assessment Total Assessment is a certain percentage of the fair market value that is determined by local assessors to be the total taxable value of land and additions on the property. | Land | Improvement |
|---|---|---|---|---|
| 2025 | $34,529 | $1,963,700 | $635,000 | $1,328,700 |
| 2024 | $32,959 | $1,129,500 | $340,000 | $789,500 |
| 2023 | $32,067 | $1,129,500 | $340,000 | $789,500 |
| 2022 | $32,067 | $1,129,500 | $340,000 | $789,500 |
| 2021 | $31,276 | $1,129,500 | $340,000 | $789,500 |
| 2020 | $30,542 | $1,129,500 | $340,000 | $789,500 |
| 2019 | $29,661 | $1,129,500 | $340,000 | $789,500 |
| 2018 | $28,746 | $1,129,500 | $340,000 | $789,500 |
| 2017 | $28,057 | $1,129,500 | $340,000 | $789,500 |
| 2016 | $27,616 | $1,129,500 | $340,000 | $789,500 |
| 2015 | $27,244 | $1,129,500 | $340,000 | $789,500 |
| 2014 | $26,656 | $1,129,500 | $340,000 | $789,500 |
Source: Public Records
Map
Nearby Homes
Your Personal Tour Guide
Ask me questions while you tour the home.