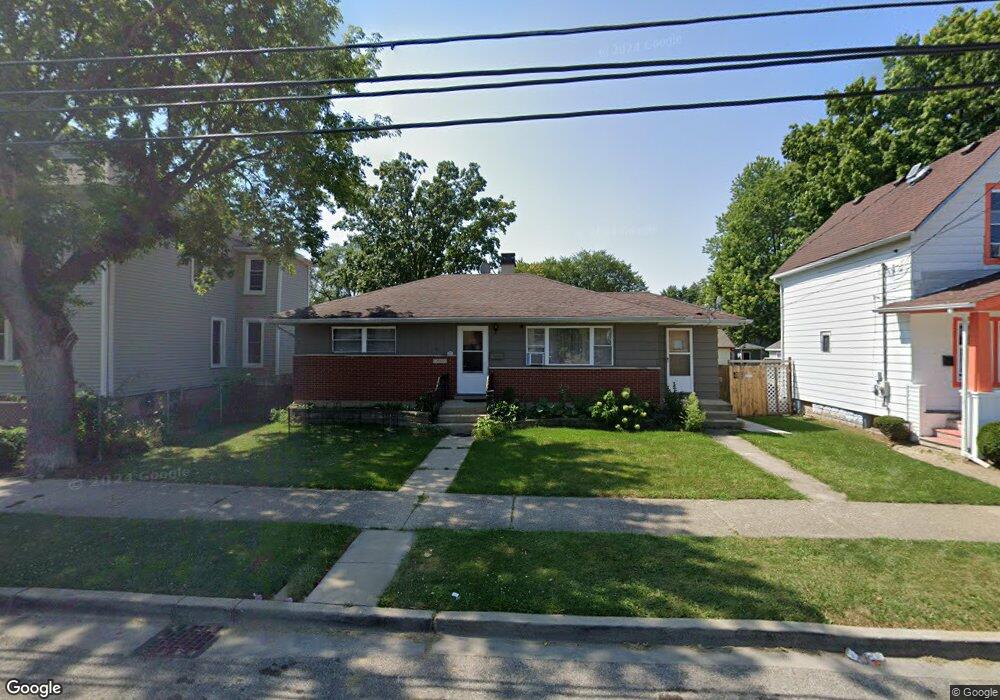
50 S Butrick St Waukegan, IL 60085
West Waukegan NeighborhoodEstimated Value: $243,357 - $337,000
--
Bed
2
Baths
1,829
Sq Ft
$159/Sq Ft
Est. Value
About This Home
This home is located at 50 S Butrick St, Waukegan, IL 60085 and is currently estimated at $290,339, approximately $158 per square foot. 50 S Butrick St is a home located in Lake County with nearby schools including Washington Elementary School, Robert E. Abbott Middle School, and Waukegan High School.
Ownership History
Date
Name
Owned For
Owner Type
Purchase Details
Closed on
Apr 24, 2023
Sold by
Ortiz Marine
Bought by
Ortiz Marine
Current Estimated Value
Purchase Details
Closed on
Jan 10, 2003
Sold by
Ortiz Marine and Ortiz Carlota
Bought by
Ortiz Marine and Ortiz Carlota
Home Financials for this Owner
Home Financials are based on the most recent Mortgage that was taken out on this home.
Original Mortgage
$125,250
Interest Rate
5.71%
Mortgage Type
Commercial
Purchase Details
Closed on
Feb 1, 2001
Sold by
Ortiz Marine and Ortiz Carlota
Bought by
Ortiz Marine and Ortiz Carlota
Purchase Details
Closed on
Jul 28, 1999
Sold by
Myers Steven E and Welker Lavonne R
Bought by
Ortiz Marine and Ortiz Carlota
Home Financials for this Owner
Home Financials are based on the most recent Mortgage that was taken out on this home.
Original Mortgage
$123,066
Interest Rate
8.21%
Mortgage Type
FHA
Purchase Details
Closed on
Apr 2, 1999
Sold by
Myers Delbert and Myers Delbert E
Bought by
Myers Delbert and Delbert Myers Declaration Of Trust
Create a Home Valuation Report for This Property
The Home Valuation Report is an in-depth analysis detailing your home's value as well as a comparison with similar homes in the area
Home Values in the Area
Average Home Value in this Area
Purchase History
| Date | Buyer | Sale Price | Title Company |
|---|---|---|---|
| Ortiz Marine | -- | None Listed On Document | |
| Ortiz Marine | -- | World Title Guaranty Inc | |
| Ortiz Marine | -- | Multiple | |
| Ortiz Marine | $124,000 | -- | |
| Myers Delbert | -- | -- |
Source: Public Records
Mortgage History
| Date | Status | Borrower | Loan Amount |
|---|---|---|---|
| Previous Owner | Ortiz Marine | $125,250 | |
| Previous Owner | Ortiz Marine | $123,066 | |
| Closed | Ortiz Marine | $3,000 |
Source: Public Records
Tax History Compared to Growth
Tax History
| Year | Tax Paid | Tax Assessment Tax Assessment Total Assessment is a certain percentage of the fair market value that is determined by local assessors to be the total taxable value of land and additions on the property. | Land | Improvement |
|---|---|---|---|---|
| 2024 | $5,788 | $77,564 | $7,510 | $70,054 |
| 2023 | $5,669 | $69,382 | $6,717 | $62,665 |
| 2022 | $5,669 | $63,992 | $5,963 | $58,029 |
| 2021 | $4,944 | $53,418 | $5,129 | $48,289 |
| 2020 | $4,961 | $49,765 | $4,778 | $44,987 |
| 2019 | $4,940 | $45,601 | $4,378 | $41,223 |
| 2018 | $4,103 | $38,112 | $6,196 | $31,916 |
| 2017 | $3,943 | $33,719 | $5,482 | $28,237 |
| 2016 | $3,601 | $29,301 | $4,764 | $24,537 |
| 2015 | $3,416 | $26,225 | $4,264 | $21,961 |
| 2014 | $3,713 | $27,483 | $4,599 | $22,884 |
| 2012 | $4,821 | $29,776 | $4,983 | $24,793 |
Source: Public Records
Map
Nearby Homes
- 1521 Catalpa Ave
- 1416 Hamilton Ct
- 23 N Jackson St
- 49 S Lewis Ave
- 304 Powell Ave
- 446 S Jackson St
- 28 N Saint James St
- 613 Washington St
- 610 Bluff St
- 305 Besley Place
- 613 Clarke Ave
- 557 W Water St
- 408 Besley Place
- 215 S Park Ave
- 502 Belvidere Rd
- 511 Chestnut St
- 428 N Poplar St
- 12601 W Atlantic Ave
- 2116 & 2101 Williamsburg Dr
- 522 George Ave
- 54 S Butrick St
- 46 S Butrick St
- 42 S Butrick St
- 1414 Catalpa St
- 45 S Maple Ave
- 40 S Butrick St
- 43 S Maple Ave
- 1418 Catalpa St
- 45 S Butrick St
- 102 S Butrick St
- 41 S Maple Ave
- 41 S Butrick St
- 1413 Catalpa St
- 34 S Butrick St
- 35 S Maple Ave
- 108 S Butrick St
- 101 S Butrick St
- 1417 Catalpa St
- 31 S Maple Ave
- 110 S Butrick St