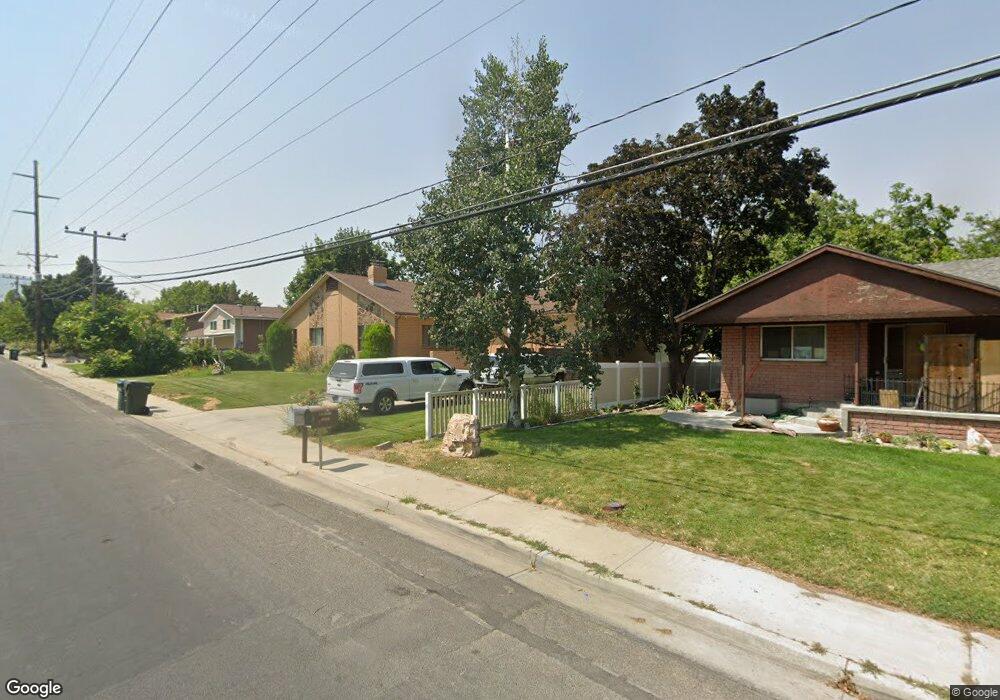
50 S Coleman St Tooele, UT 84074
Estimated Value: $438,000 - $514,000
--
Bed
--
Bath
2,520
Sq Ft
$184/Sq Ft
Est. Value
About This Home
This home is located at 50 S Coleman St, Tooele, UT 84074 and is currently estimated at $463,145, approximately $183 per square foot. 50 S Coleman St is a home with nearby schools including Northlake Elementary School, West Elementary School, and Tooele Junior High School.
Ownership History
Date
Name
Owned For
Owner Type
Purchase Details
Closed on
Oct 24, 2020
Sold by
Bennett Kristine and Keele Vance R
Bought by
Bennett Kristine
Current Estimated Value
Purchase Details
Closed on
Oct 14, 2010
Sold by
Keele Vance Ray and Keele Shirley Mae
Bought by
Keele Vance R and Keele Shirley R
Create a Home Valuation Report for This Property
The Home Valuation Report is an in-depth analysis detailing your home's value as well as a comparison with similar homes in the area
Home Values in the Area
Average Home Value in this Area
Purchase History
| Date | Buyer | Sale Price | Title Company |
|---|---|---|---|
| Bennett Kristine | -- | None Available | |
| Keele Vance R | -- | None Available |
Source: Public Records
Tax History Compared to Growth
Tax History
| Year | Tax Paid | Tax Assessment Tax Assessment Total Assessment is a certain percentage of the fair market value that is determined by local assessors to be the total taxable value of land and additions on the property. | Land | Improvement |
|---|---|---|---|---|
| 2025 | $3,001 | $250,345 | $79,200 | $171,145 |
| 2024 | $3,436 | $262,265 | $79,200 | $183,065 |
| 2023 | $3,436 | $247,850 | $75,349 | $172,501 |
| 2022 | $2,582 | $222,121 | $79,640 | $142,481 |
| 2021 | $2,121 | $152,657 | $32,450 | $120,207 |
| 2020 | $2,022 | $252,414 | $59,000 | $193,414 |
| 2019 | $1,887 | $231,691 | $59,000 | $172,691 |
| 2018 | $1,934 | $225,166 | $75,000 | $150,166 |
| 2017 | $1,289 | $175,595 | $46,250 | $129,345 |
| 2016 | $1,104 | $88,863 | $25,438 | $63,425 |
| 2015 | $1,104 | $80,270 | $0 | $0 |
| 2014 | -- | $80,270 | $0 | $0 |
Source: Public Records
Map
Nearby Homes