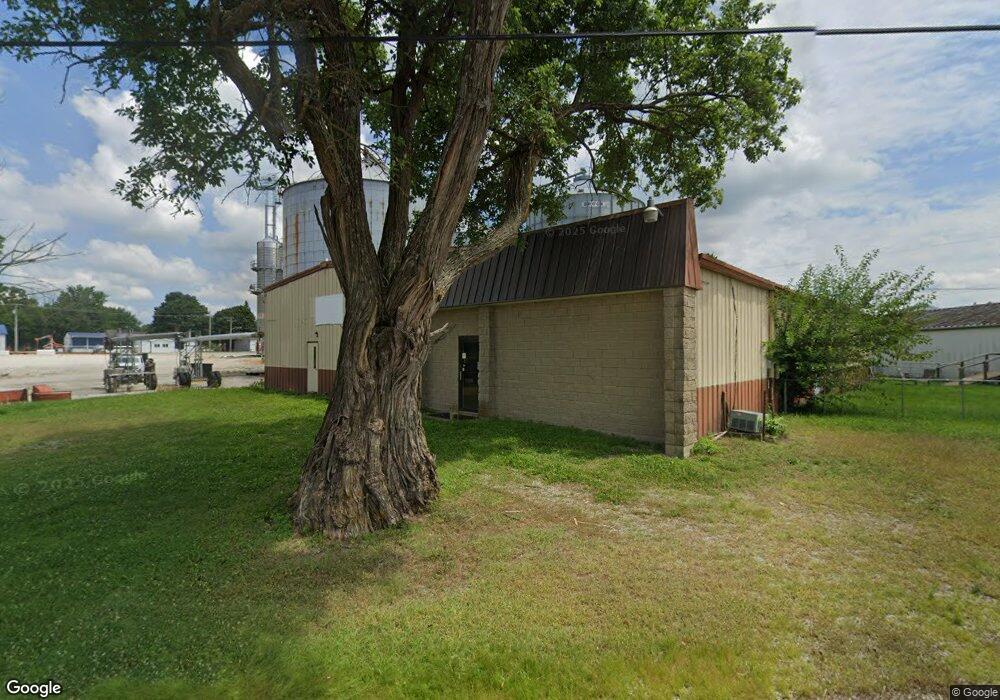
50 S Limestone St Jamestown, OH 45335
Estimated Value: $220,513
--
Bed
--
Bath
5,600
Sq Ft
$39/Sq Ft
Est. Value
About This Home
This home is located at 50 S Limestone St, Jamestown, OH 45335 and is currently estimated at $220,513, approximately $39 per square foot. 50 S Limestone St is a home located in Greene County with nearby schools including Greeneview Elementary School, Greeneview Middle School, and Greeneview High School.
Ownership History
Date
Name
Owned For
Owner Type
Purchase Details
Closed on
Apr 16, 2014
Sold by
Webco Enterprise Llc
Bought by
Shorpies Llc
Current Estimated Value
Purchase Details
Closed on
Nov 20, 2009
Sold by
D L Sargent Llc
Bought by
Webco Enterprises Llc
Home Financials for this Owner
Home Financials are based on the most recent Mortgage that was taken out on this home.
Original Mortgage
$100,000
Interest Rate
4.95%
Mortgage Type
Seller Take Back
Purchase Details
Closed on
Jun 23, 2006
Sold by
Necina Teri L
Bought by
Sargent Denny L and Sargent Kimberly A
Home Financials for this Owner
Home Financials are based on the most recent Mortgage that was taken out on this home.
Original Mortgage
$125,000
Interest Rate
6.72%
Mortgage Type
Commercial
Purchase Details
Closed on
May 11, 2005
Sold by
Estate Of Ronald Necina
Bought by
Necina Teri L and Necina Michael
Purchase Details
Closed on
May 9, 2005
Sold by
Necina Michael
Bought by
Necina Teri L
Create a Home Valuation Report for This Property
The Home Valuation Report is an in-depth analysis detailing your home's value as well as a comparison with similar homes in the area
Home Values in the Area
Average Home Value in this Area
Purchase History
| Date | Buyer | Sale Price | Title Company |
|---|---|---|---|
| Shorpies Llc | $100,000 | None Available | |
| Webco Enterprises Llc | $125,000 | Attorney | |
| D L Sargent Llc | -- | Attorney | |
| Sargent Denny L | $125,000 | None Available | |
| Necina Teri L | -- | -- | |
| Necina Teri L | -- | -- |
Source: Public Records
Mortgage History
| Date | Status | Borrower | Loan Amount |
|---|---|---|---|
| Previous Owner | Webco Enterprises Llc | $100,000 | |
| Previous Owner | Sargent Denny L | $125,000 |
Source: Public Records
Tax History Compared to Growth
Tax History
| Year | Tax Paid | Tax Assessment Tax Assessment Total Assessment is a certain percentage of the fair market value that is determined by local assessors to be the total taxable value of land and additions on the property. | Land | Improvement |
|---|---|---|---|---|
| 2024 | $2,561 | $42,460 | $11,830 | $30,630 |
| 2023 | $2,561 | $42,460 | $11,830 | $30,630 |
| 2022 | $2,577 | $39,970 | $11,830 | $28,140 |
| 2021 | $2,599 | $39,970 | $11,830 | $28,140 |
| 2020 | $2,424 | $39,970 | $11,830 | $28,140 |
| 2019 | $2,446 | $37,500 | $11,830 | $25,670 |
| 2018 | $2,460 | $37,500 | $11,830 | $25,670 |
| 2017 | $2,400 | $37,500 | $11,830 | $25,670 |
| 2016 | $2,721 | $42,110 | $14,790 | $27,320 |
| 2015 | $2,667 | $42,110 | $14,790 | $27,320 |
| 2014 | $1,284 | $42,110 | $14,790 | $27,320 |
Source: Public Records
Map
Nearby Homes
- 26 S Limestone St
- 21 S Buckles Ave
- 21 E Xenia St
- 55 E Xenia St
- 4620 82 1/2 x 161 Nelson St
- 56 W Xenia St
- 14 Brookside St
- 280 S Charleston Rd
- 3 Brookside St
- 8 Maplewood Dr
- 5852 Old Us Route 35 E
- 0 Brickel Rd Unit 1850484
- 0 Apache Trail Unit 941961
- 4737 Cottonville Rd
- 204 Ivy Creek Cove
- 12.139ac Cherry Grove Rd
- 4270 Shawnee Trail
- 973 Garringer Rd
- 4208 Shawnee Trail
- 4184 Shawnee Trail
- 55 S Limestone St
- 58 S Limestone St
- 53 S Limestone St
- 59 S Limestone St
- 63 S Limestone St
- 7 Verity St
- 67 S Limestone St
- 9 Verity St
- 6 Verity St
- 19 S Church St
- 14 S Sycamore St
- 20 S Church St
- 17 S Church St
- 1 Clemens Ave
- 5 Clemens Ave
- 15 S Church St
- 18 S Church St
- 33 S Limestone St
- 7 Clemens Ave
- 15 Verity St