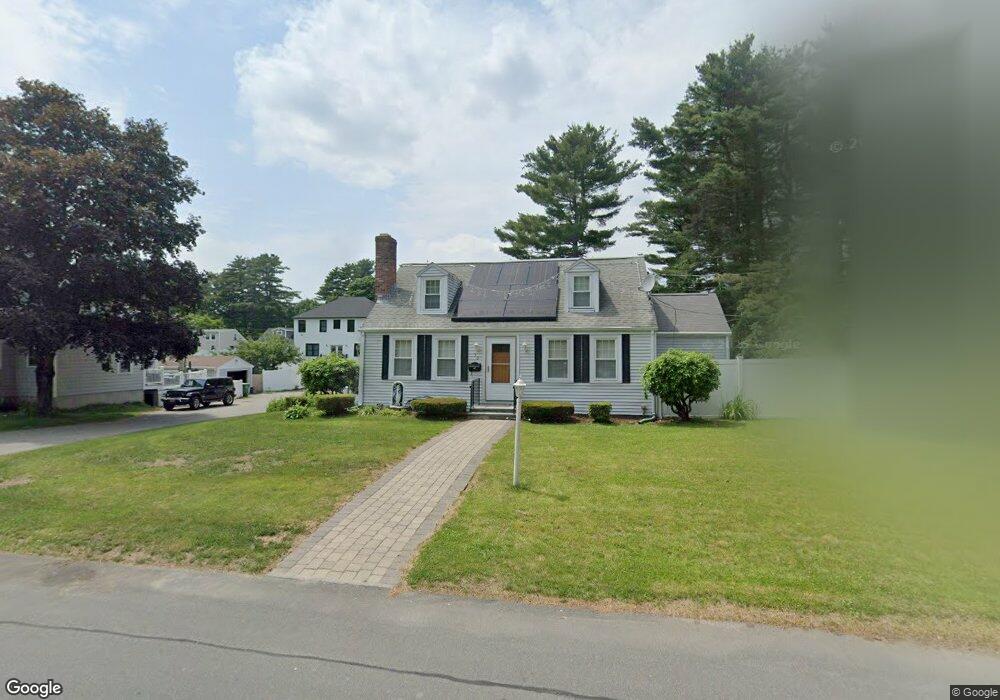
50 Sexton Ave Westwood, MA 02090
Estimated Value: $782,000 - $1,016,000
2
Beds
3
Baths
1,435
Sq Ft
$630/Sq Ft
Est. Value
About This Home
This home is located at 50 Sexton Ave, Westwood, MA 02090 and is currently estimated at $903,614, approximately $629 per square foot. 50 Sexton Ave is a home located in Norfolk County with nearby schools including Westwood High School, St Catherine Of Siena School, and Xaverian Brothers High School.
Ownership History
Date
Name
Owned For
Owner Type
Purchase Details
Closed on
Feb 19, 2025
Sold by
Shamoon Josephine P and Shamoon Joseph P
Bought by
50 Sexton Avenue Nt and Shamoon
Current Estimated Value
Purchase Details
Closed on
Oct 24, 2006
Sold by
Savary George J and Savary Sandra L
Bought by
Shamoon Josephine P
Home Financials for this Owner
Home Financials are based on the most recent Mortgage that was taken out on this home.
Original Mortgage
$320,000
Interest Rate
6.49%
Mortgage Type
Purchase Money Mortgage
Create a Home Valuation Report for This Property
The Home Valuation Report is an in-depth analysis detailing your home's value as well as a comparison with similar homes in the area
Home Values in the Area
Average Home Value in this Area
Purchase History
| Date | Buyer | Sale Price | Title Company |
|---|---|---|---|
| 50 Sexton Avenue Nt | -- | None Available | |
| 50 Sexton Avenue Nt | -- | None Available | |
| Shamoon Josephine P | $420,000 | -- | |
| Shamoon Josephine P | $420,000 | -- |
Source: Public Records
Mortgage History
| Date | Status | Borrower | Loan Amount |
|---|---|---|---|
| Previous Owner | Shamoon Josephine P | $322,000 | |
| Previous Owner | Shamoon Josephine P | $320,000 | |
| Previous Owner | Shamoon Josephine P | $20,000 |
Source: Public Records
Tax History Compared to Growth
Tax History
| Year | Tax Paid | Tax Assessment Tax Assessment Total Assessment is a certain percentage of the fair market value that is determined by local assessors to be the total taxable value of land and additions on the property. | Land | Improvement |
|---|---|---|---|---|
| 2025 | $10,633 | $830,700 | $513,000 | $317,700 |
| 2024 | $10,167 | $793,700 | $488,500 | $305,200 |
| 2023 | $9,115 | $637,400 | $407,000 | $230,400 |
| 2022 | $8,523 | $574,700 | $344,350 | $230,350 |
| 2021 | $8,637 | $584,350 | $327,800 | $256,550 |
| 2020 | $8,189 | $564,400 | $327,800 | $236,600 |
| 2019 | $7,948 | $542,550 | $312,200 | $230,350 |
| 2018 | $7,635 | $505,950 | $312,200 | $193,750 |
| 2017 | $7,404 | $508,150 | $312,200 | $195,950 |
| 2016 | $7,306 | $498,350 | $312,200 | $186,150 |
| 2015 | $6,849 | $449,400 | $312,200 | $137,200 |
Source: Public Records
Map
Nearby Homes