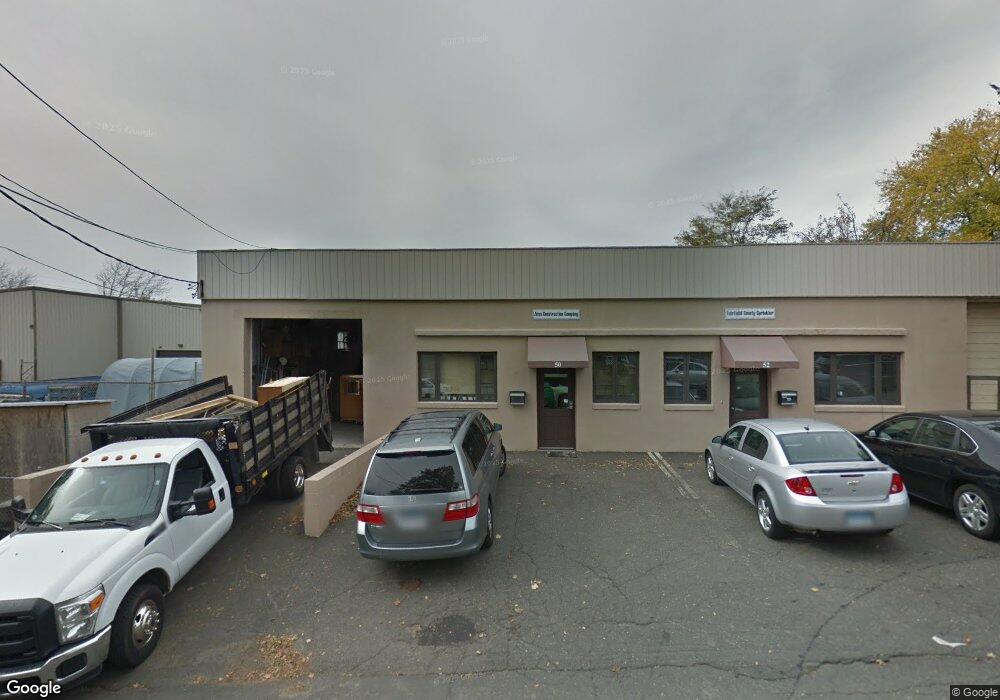
50 Sheridan St Stratford, CT 06615
Stratford Center Historic District NeighborhoodEstimated Value: $666,633
--
Bed
--
Bath
6,400
Sq Ft
$104/Sq Ft
Est. Value
About This Home
This home is located at 50 Sheridan St, Stratford, CT 06615 and is currently estimated at $666,633, approximately $104 per square foot. 50 Sheridan St is a home located in Fairfield County with nearby schools including Franklin School, Harry B. Flood Middle School, and Bunnell High School.
Ownership History
Date
Name
Owned For
Owner Type
Purchase Details
Closed on
Jul 30, 2020
Sold by
Zeiss Realty Llc
Bought by
50 Sheridan St Llc
Current Estimated Value
Home Financials for this Owner
Home Financials are based on the most recent Mortgage that was taken out on this home.
Original Mortgage
$386,000
Outstanding Balance
$341,638
Interest Rate
3%
Mortgage Type
New Conventional
Estimated Equity
$316,561
Purchase Details
Closed on
Mar 4, 2019
Sold by
Zeiss John J
Bought by
Zeiss Realty Llc
Purchase Details
Closed on
Oct 10, 2003
Sold by
Ryan John M and Ryan Robert A
Bought by
Zeiss John J
Purchase Details
Closed on
May 24, 1995
Sold by
Copsey Rebecca and Wilber Harriet
Bought by
Ryan John and Ryan Robert
Home Financials for this Owner
Home Financials are based on the most recent Mortgage that was taken out on this home.
Original Mortgage
$190,000
Interest Rate
8.33%
Mortgage Type
Commercial
Create a Home Valuation Report for This Property
The Home Valuation Report is an in-depth analysis detailing your home's value as well as a comparison with similar homes in the area
Home Values in the Area
Average Home Value in this Area
Purchase History
| Date | Buyer | Sale Price | Title Company |
|---|---|---|---|
| 50 Sheridan St Llc | $400,000 | None Available | |
| 50 Sheridan St Llc | $400,000 | None Available | |
| Zeiss Realty Llc | -- | -- | |
| Zeiss Realty Llc | -- | -- | |
| Zeiss John J | $270,000 | -- | |
| Zeiss John J | $270,000 | -- | |
| Ryan John | $240,000 | -- | |
| Ryan John | $240,000 | -- |
Source: Public Records
Mortgage History
| Date | Status | Borrower | Loan Amount |
|---|---|---|---|
| Open | 50 Sheridan St Llc | $386,000 | |
| Closed | 50 Sheridan St Llc | $386,000 | |
| Previous Owner | Ryan John | $190,000 | |
| Previous Owner | Ryan John | $125,000 |
Source: Public Records
Tax History Compared to Growth
Tax History
| Year | Tax Paid | Tax Assessment Tax Assessment Total Assessment is a certain percentage of the fair market value that is determined by local assessors to be the total taxable value of land and additions on the property. | Land | Improvement |
|---|---|---|---|---|
| 2025 | $12,187 | $303,170 | $94,710 | $208,460 |
| 2024 | $12,187 | $303,170 | $94,710 | $208,460 |
| 2023 | $12,187 | $303,170 | $94,710 | $208,460 |
| 2022 | $11,963 | $303,170 | $94,710 | $208,460 |
| 2021 | $11,966 | $303,170 | $94,710 | $208,460 |
| 2020 | $12,018 | $303,170 | $94,710 | $208,460 |
| 2019 | $12,224 | $306,600 | $90,860 | $215,740 |
| 2018 | $12,233 | $306,600 | $90,860 | $215,740 |
| 2017 | $12,255 | $306,600 | $90,860 | $215,740 |
| 2016 | $11,954 | $306,600 | $90,860 | $215,740 |
| 2015 | $11,338 | $306,600 | $90,860 | $215,740 |
| 2014 | $10,737 | $301,350 | $94,290 | $207,060 |
Source: Public Records
Map
Nearby Homes
- 239 Hollister St
- 154 Soundview Ave
- 345 Burritt Ave
- 196 Avon St
- 59 Lenox Ave
- 415 Bruce Ave
- 88 Knowlton St
- 68 Edwin St Unit 70
- 394 Bishop Ave Unit 396
- 1840 Barnum Ave
- 2152 Barnum Ave
- 1804 Barnum Ave
- 160 Oakland Place
- 17 Miranda Ln
- 102 Bowe Ave
- 270 East Ave
- 528 Soundview Ave
- 106 Elizabeth St
- 1034 Connecticut Ave
- 66 Roosevelt Ave
- 101 Sheridan St
- 86 Sheridan St
- 329 Jackson Ave
- 319 Jackson Ave
- 337 Jackson Ave
- 264 Seymour St
- 349 Jackson Ave
- 52 Sheridan St
- 259 Jackson Ave
- 339 Jackson Ave
- 269 Jackson Ave
- 43 Hancock St
- 328 Jackson Ave
- 367 Jackson Ave Unit 1L
- 367 Jackson Ave Unit 2R
- 367 Jackson Ave Unit 2nd Floor
- 367 Jackson Ave
- 369 Jackson Ave Unit 2-R
- 7 Thompson St
- 279 Jackson Ave