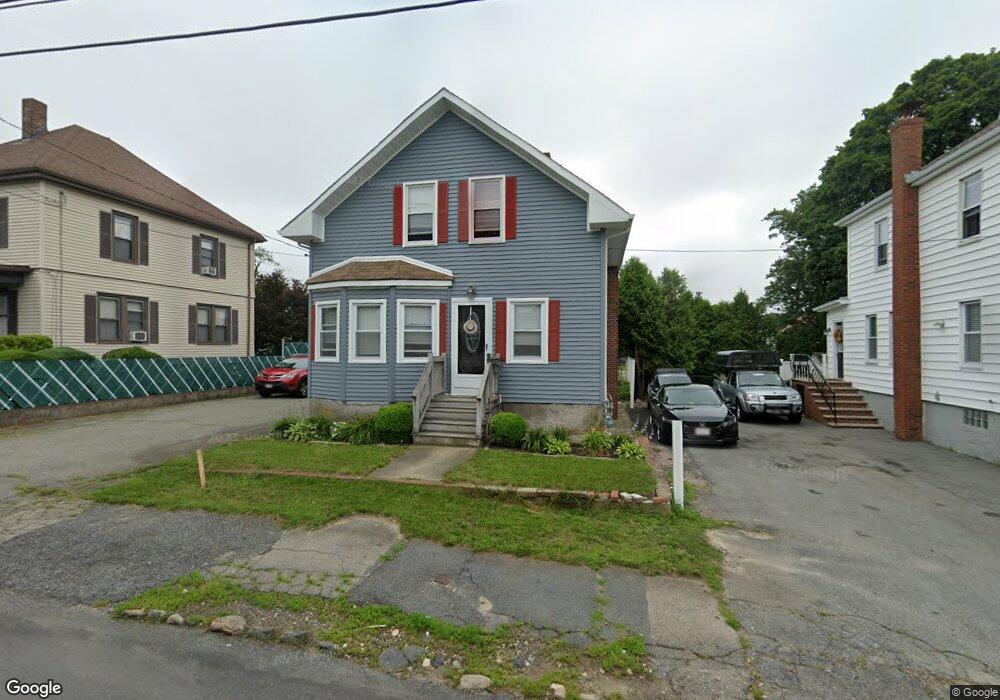
50 Slocum St Acushnet, MA 02743
Estimated Value: $427,664 - $451,000
4
Beds
1
Bath
1,920
Sq Ft
$229/Sq Ft
Est. Value
About This Home
This home is located at 50 Slocum St, Acushnet, MA 02743 and is currently estimated at $440,416, approximately $229 per square foot. 50 Slocum St is a home located in Bristol County with nearby schools including Acushnet Elementary School, Albert F Ford Middle School, and Alma Del Mar Charter School.
Ownership History
Date
Name
Owned For
Owner Type
Purchase Details
Closed on
Dec 4, 2024
Sold by
Cardozo Joaquim R and Cardozo Joanne M
Bought by
Cardozo Ft and Cardozo
Current Estimated Value
Purchase Details
Closed on
Jan 9, 2003
Sold by
Picard Suzanne L
Bought by
Cardozo Joaquim R and Cardozo Joanne M
Home Financials for this Owner
Home Financials are based on the most recent Mortgage that was taken out on this home.
Original Mortgage
$172,900
Interest Rate
6.19%
Mortgage Type
Purchase Money Mortgage
Create a Home Valuation Report for This Property
The Home Valuation Report is an in-depth analysis detailing your home's value as well as a comparison with similar homes in the area
Home Values in the Area
Average Home Value in this Area
Purchase History
| Date | Buyer | Sale Price | Title Company |
|---|---|---|---|
| Cardozo Ft | -- | None Available | |
| Cardozo Ft | -- | None Available | |
| Cardozo Joaquim R | $172,900 | -- | |
| Cardozo Joaquim R | $172,900 | -- |
Source: Public Records
Mortgage History
| Date | Status | Borrower | Loan Amount |
|---|---|---|---|
| Previous Owner | Cardozo Joaquim R | $172,900 | |
| Previous Owner | Cardozo Joaquim R | $68,886 |
Source: Public Records
Tax History Compared to Growth
Tax History
| Year | Tax Paid | Tax Assessment Tax Assessment Total Assessment is a certain percentage of the fair market value that is determined by local assessors to be the total taxable value of land and additions on the property. | Land | Improvement |
|---|---|---|---|---|
| 2025 | $35 | $326,500 | $87,600 | $238,900 |
| 2024 | $3,585 | $314,200 | $83,500 | $230,700 |
| 2023 | $3,350 | $279,200 | $75,400 | $203,800 |
| 2022 | $3,414 | $257,300 | $71,300 | $186,000 |
| 2021 | $0 | $223,000 | $71,300 | $151,700 |
| 2020 | $3,109 | $223,000 | $71,300 | $151,700 |
| 2019 | $2,857 | $201,500 | $63,200 | $138,300 |
| 2018 | $6,962 | $191,100 | $63,200 | $127,900 |
| 2017 | $2,628 | $182,000 | $63,200 | $118,800 |
| 2016 | $2,472 | $170,100 | $63,200 | $106,900 |
| 2015 | $2,429 | $170,100 | $63,200 | $106,900 |
Source: Public Records
Map
Nearby Homes