50 Smith Rd Charlton, MA 01507
Estimated Value: $653,000 - $960,000
3
Beds
3
Baths
2,992
Sq Ft
$257/Sq Ft
Est. Value
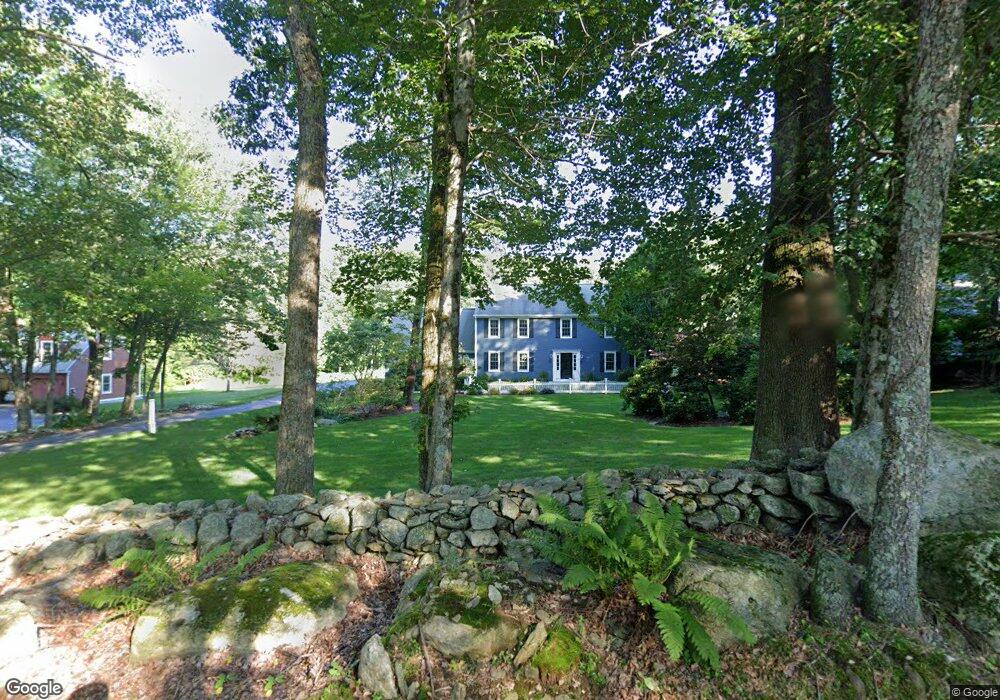
About This Home
This home is located at 50 Smith Rd, Charlton, MA 01507 and is currently estimated at $769,204, approximately $257 per square foot. 50 Smith Rd is a home located in Worcester County with nearby schools including Shepherd Hill Regional High School.
Ownership History
Date
Name
Owned For
Owner Type
Purchase Details
Closed on
Feb 15, 2024
Sold by
Lilley Brian E and Lilley Michelle J
Bought by
Lilley Nt and Lilley
Current Estimated Value
Purchase Details
Closed on
Jun 17, 2011
Sold by
Tucker Farm Estates In
Bought by
Lilley Brian E and Lilley Michelle J
Purchase Details
Closed on
May 30, 1997
Sold by
Cote Walter and Cote Jean Ann
Bought by
Lilley Brian E and Lilley Michelle J
Create a Home Valuation Report for This Property
The Home Valuation Report is an in-depth analysis detailing your home's value as well as a comparison with similar homes in the area
Home Values in the Area
Average Home Value in this Area
Purchase History
| Date | Buyer | Sale Price | Title Company |
|---|---|---|---|
| Lilley Nt | -- | None Available | |
| Lilley Nt | -- | None Available | |
| Lilley Brian E | $45,000 | -- | |
| Lilley Brian E | $45,000 | -- | |
| Lilley Brian E | $244,000 | -- | |
| Lilley Brian E | $244,000 | -- |
Source: Public Records
Mortgage History
| Date | Status | Borrower | Loan Amount |
|---|---|---|---|
| Previous Owner | Lilley Brian E | $210,000 | |
| Previous Owner | Lilley Brian E | $200,000 | |
| Previous Owner | Lilley Brian E | $20,000 |
Source: Public Records
Tax History Compared to Growth
Tax History
| Year | Tax Paid | Tax Assessment Tax Assessment Total Assessment is a certain percentage of the fair market value that is determined by local assessors to be the total taxable value of land and additions on the property. | Land | Improvement |
|---|---|---|---|---|
| 2025 | $6,921 | $621,800 | $111,200 | $510,600 |
| 2024 | $6,709 | $591,600 | $105,200 | $486,400 |
| 2023 | $6,613 | $543,400 | $105,100 | $438,300 |
| 2022 | $6,466 | $486,500 | $96,100 | $390,400 |
| 2021 | $5,729 | $381,700 | $84,100 | $297,600 |
| 2020 | $5,671 | $379,600 | $78,100 | $301,500 |
| 2019 | $5,607 | $379,600 | $78,100 | $301,500 |
| 2018 | $5,125 | $379,600 | $78,100 | $301,500 |
| 2017 | $5,024 | $356,300 | $78,100 | $278,200 |
| 2016 | $4,910 | $356,300 | $78,100 | $278,200 |
| 2015 | $4,782 | $356,300 | $78,100 | $278,200 |
| 2014 | $4,489 | $354,600 | $73,100 | $281,500 |
Source: Public Records
Map
Nearby Homes