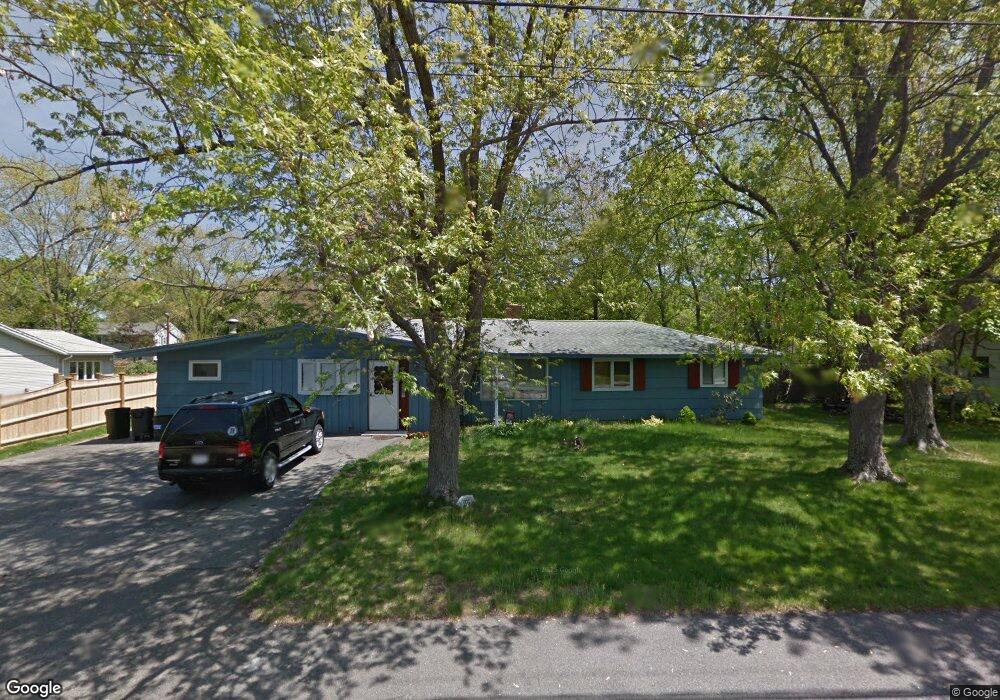
50 Spring St Braintree, MA 02184
South Braintree NeighborhoodEstimated Value: $705,462 - $800,000
5
Beds
3
Baths
1,875
Sq Ft
$403/Sq Ft
Est. Value
About This Home
This home is located at 50 Spring St, Braintree, MA 02184 and is currently estimated at $755,366, approximately $402 per square foot. 50 Spring St is a home located in Norfolk County with nearby schools including Braintree High School, Step Ahead Kindergarten, and Sacred Heart Elementary School.
Ownership History
Date
Name
Owned For
Owner Type
Purchase Details
Closed on
Jul 26, 2005
Sold by
Brown Marion C
Bought by
Brown John and Brown Patricia
Current Estimated Value
Home Financials for this Owner
Home Financials are based on the most recent Mortgage that was taken out on this home.
Original Mortgage
$235,000
Outstanding Balance
$122,893
Interest Rate
5.59%
Mortgage Type
Purchase Money Mortgage
Estimated Equity
$632,473
Create a Home Valuation Report for This Property
The Home Valuation Report is an in-depth analysis detailing your home's value as well as a comparison with similar homes in the area
Home Values in the Area
Average Home Value in this Area
Purchase History
| Date | Buyer | Sale Price | Title Company |
|---|---|---|---|
| Brown John | $422,000 | -- |
Source: Public Records
Mortgage History
| Date | Status | Borrower | Loan Amount |
|---|---|---|---|
| Open | Brown John | $235,000 |
Source: Public Records
Tax History
| Year | Tax Paid | Tax Assessment Tax Assessment Total Assessment is a certain percentage of the fair market value that is determined by local assessors to be the total taxable value of land and additions on the property. | Land | Improvement |
|---|---|---|---|---|
| 2025 | $6,224 | $623,600 | $399,000 | $224,600 |
| 2024 | $5,547 | $585,100 | $362,300 | $222,800 |
| 2023 | $5,221 | $534,900 | $325,500 | $209,400 |
| 2022 | $5,009 | $503,400 | $294,000 | $209,400 |
| 2021 | $4,594 | $461,700 | $265,700 | $196,000 |
| 2020 | $4,314 | $437,500 | $241,500 | $196,000 |
| 2019 | $4,091 | $405,500 | $231,000 | $174,500 |
| 2018 | $3,982 | $377,800 | $210,000 | $167,800 |
| 2017 | $3,945 | $367,300 | $199,500 | $167,800 |
| 2016 | $3,873 | $352,700 | $189,000 | $163,700 |
| 2015 | $3,556 | $321,200 | $157,500 | $163,700 |
| 2014 | $3,351 | $293,400 | $151,200 | $142,200 |
Source: Public Records
Map
Nearby Homes
- 426 John Mahar Hwy Unit 311
- 426 John Mahar Hwy Unit 406
- 418 John Mahar Hwy Unit 408
- 422 John Mahar Hwy Unit 408
- 605 Middle St Unit 38
- 564 Middle St
- 31 Doris Rd
- 43 Grove Cir
- 972 Liberty St
- 145 Hancock St Unit 307
- 145 Hancock St Unit 201
- 1201 Matthew Woods Dr Unit 1201
- 5 Woodsum Dr Unit 12
- 6 Franklin St
- 432 Grove St
- 501 Commerce Dr Unit 2110
- 501 Commerce Dr Unit 4308
- 36 Chestnut Ave
- 441 Grove St
- 632 Washington St Unit G5
Your Personal Tour Guide
Ask me questions while you tour the home.