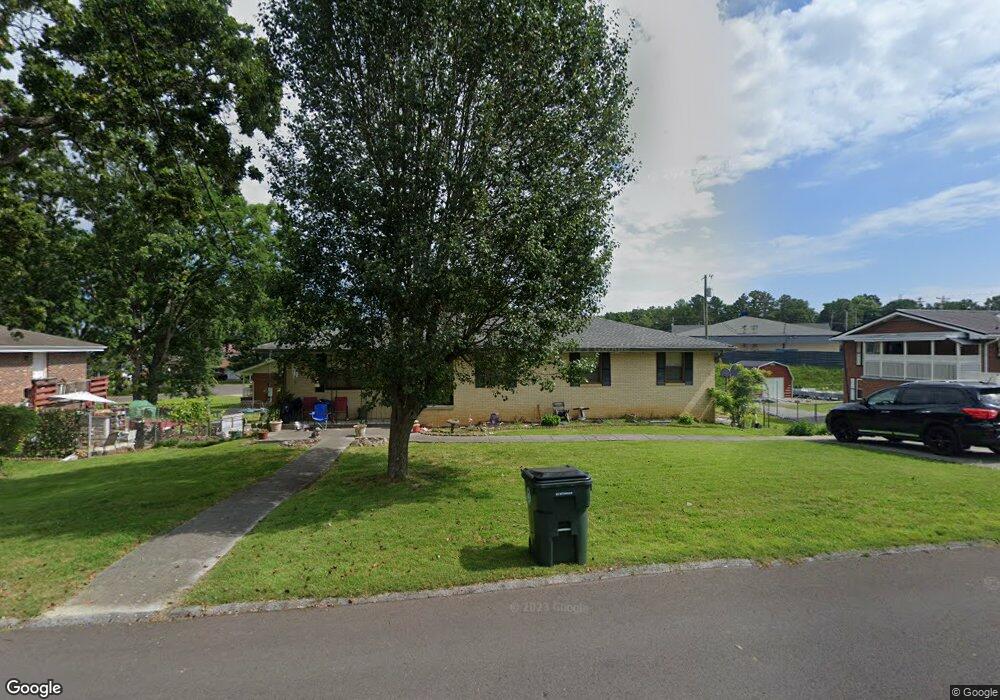
50 Stuart Rd Fort Oglethorpe, GA 30742
Estimated Value: $238,664 - $292,000
Studio
2
Baths
1,710
Sq Ft
$158/Sq Ft
Est. Value
About This Home
This home is located at 50 Stuart Rd, Fort Oglethorpe, GA 30742 and is currently estimated at $270,166, approximately $157 per square foot. 50 Stuart Rd is a home located in Catoosa County with nearby schools including Battlefield Primary School, Battlefield Elementary School, and Lakeview Middle School.
Ownership History
Date
Name
Owned For
Owner Type
Purchase Details
Closed on
Nov 18, 2025
Sold by
Sisemore Bobby J
Bought by
Sisemore Bobby J and Sisemore Marsha K
Current Estimated Value
Purchase Details
Closed on
Jan 17, 1986
Bought by
Sisemore Bobby J
Create a Home Valuation Report for This Property
The Home Valuation Report is an in-depth analysis detailing your home's value as well as a comparison with similar homes in the area
Home Values in the Area
Average Home Value in this Area
Purchase History
| Date | Buyer | Sale Price | Title Company |
|---|---|---|---|
| Sisemore Bobby J | -- | -- | |
| Sisemore Bobby J | $52,000 | -- |
Source: Public Records
Tax History
| Year | Tax Paid | Tax Assessment Tax Assessment Total Assessment is a certain percentage of the fair market value that is determined by local assessors to be the total taxable value of land and additions on the property. | Land | Improvement |
|---|---|---|---|---|
| 2025 | $432 | $105,968 | $10,000 | $95,968 |
| 2024 | $585 | $94,975 | $9,055 | $85,920 |
| 2023 | $512 | $71,695 | $9,055 | $62,640 |
| 2022 | $411 | $57,985 | $9,055 | $48,930 |
| 2021 | $1,141 | $57,985 | $9,055 | $48,930 |
| 2020 | $1,492 | $50,527 | $9,055 | $41,472 |
| 2019 | $1,101 | $50,527 | $9,055 | $41,472 |
| 2018 | $1,472 | $46,977 | $9,055 | $37,922 |
| 2017 | $1,075 | $45,483 | $9,055 | $36,428 |
| 2016 | $1,019 | $42,112 | $9,055 | $33,058 |
| 2015 | -- | $42,112 | $9,055 | $33,058 |
| 2014 | -- | $42,112 | $9,055 | $33,058 |
| 2013 | -- | $42,112 | $9,054 | $33,057 |
Source: Public Records
Map
Nearby Homes
- 31 Jackson Way
- 92 S Glade Rd
- 99 Battlewood Dr
- 84 Elaine Cir
- 12 Maple Ln
- 265 S Cedar Ln
- 1605 Cannon Dr
- 47 Elaine Cir
- 1708 Cannon Dr
- 1719 Cannon Dr
- 2 Polk Cir
- 0 Dandelion Trail Unit 1528762
- 0 Dandelion Trail Unit RTC3132518
- 325 Mockingbird Ln
- 1804 Honeysuckle Trail
- 614 Lakeshore Cove Dr Unit 19
- 614 Lakeshore Cove Dr
- 351 Franklin Cir
- 301 Dogwood Ln
- 0 Westside Country Dr Unit RTC3132302
Your Personal Tour Guide
Ask me questions while you tour the home.