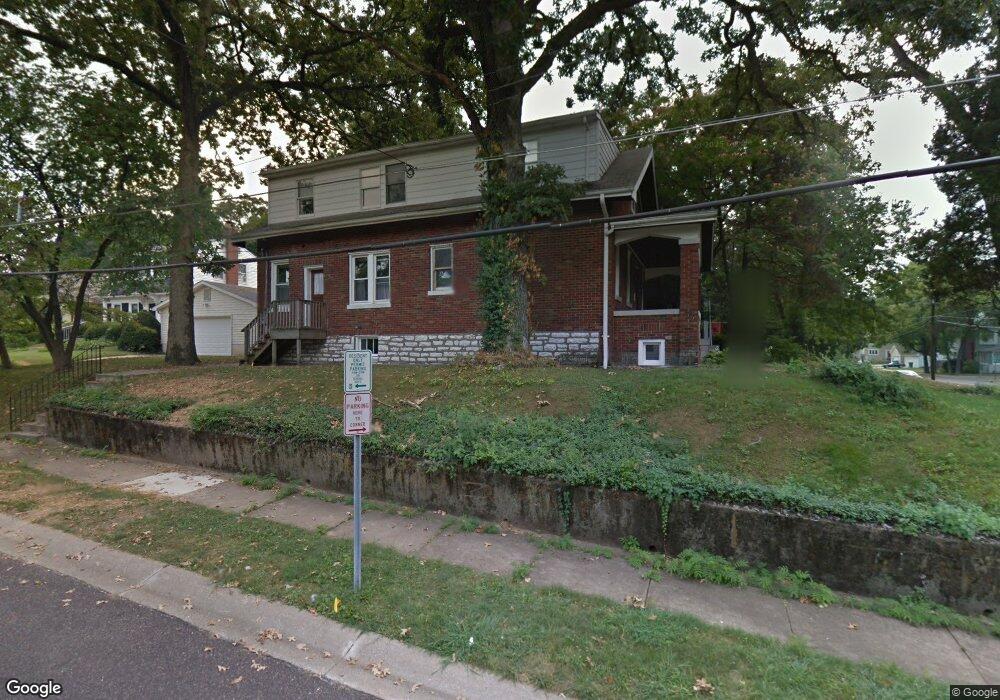
50 Summit Ave Saint Louis, MO 63119
Estimated Value: $471,000 - $544,000
3
Beds
2
Baths
1,800
Sq Ft
$284/Sq Ft
Est. Value
About This Home
This home is located at 50 Summit Ave, Saint Louis, MO 63119 and is currently estimated at $511,236, approximately $284 per square foot. 50 Summit Ave is a home located in St. Louis County with nearby schools including Avery Elementary School, Hixson Middle School, and Webster Groves High School.
Ownership History
Date
Name
Owned For
Owner Type
Purchase Details
Closed on
Nov 7, 2023
Sold by
Furrer Stephanie J and Furrer Benjamin R
Bought by
Cavanaugh Stephanie J
Current Estimated Value
Home Financials for this Owner
Home Financials are based on the most recent Mortgage that was taken out on this home.
Original Mortgage
$142,000
Outstanding Balance
$139,518
Interest Rate
7.49%
Mortgage Type
New Conventional
Estimated Equity
$371,718
Purchase Details
Closed on
Jul 19, 2011
Sold by
Banks John Lucian and Banks Judith Goodenough
Bought by
Furrer Benjamin R and Furrer Stephanie J
Home Financials for this Owner
Home Financials are based on the most recent Mortgage that was taken out on this home.
Original Mortgage
$138,000
Interest Rate
4.52%
Mortgage Type
New Conventional
Create a Home Valuation Report for This Property
The Home Valuation Report is an in-depth analysis detailing your home's value as well as a comparison with similar homes in the area
Home Values in the Area
Average Home Value in this Area
Purchase History
| Date | Buyer | Sale Price | Title Company |
|---|---|---|---|
| Cavanaugh Stephanie J | -- | Stewart Title | |
| Cavanaugh Stephanie J | -- | Stewart Title | |
| Furrer Benjamin R | $172,500 | Integrity Land Title Co Inc |
Source: Public Records
Mortgage History
| Date | Status | Borrower | Loan Amount |
|---|---|---|---|
| Open | Cavanaugh Stephanie J | $142,000 | |
| Previous Owner | Furrer Benjamin R | $138,000 |
Source: Public Records
Tax History
| Year | Tax Paid | Tax Assessment Tax Assessment Total Assessment is a certain percentage of the fair market value that is determined by local assessors to be the total taxable value of land and additions on the property. | Land | Improvement |
|---|---|---|---|---|
| 2025 | $5,116 | $80,410 | $66,500 | $13,910 |
| 2024 | $5,116 | $73,490 | $41,550 | $31,940 |
| 2023 | $5,116 | $73,490 | $41,550 | $31,940 |
| 2022 | $4,260 | $57,000 | $33,270 | $23,730 |
| 2021 | $4,245 | $60,880 | $33,270 | $27,610 |
| 2020 | $4,219 | $52,780 | $33,270 | $19,510 |
| 2019 | $4,189 | $52,780 | $33,270 | $19,510 |
| 2018 | $4,442 | $49,740 | $23,290 | $26,450 |
| 2017 | $4,412 | $49,740 | $23,290 | $26,450 |
| 2016 | $4,244 | $45,790 | $19,950 | $25,840 |
| 2015 | $4,261 | $45,790 | $19,950 | $25,840 |
| 2014 | $4,318 | $45,150 | $15,300 | $29,850 |
Source: Public Records
Map
Nearby Homes
- 643 Elmwood Ave
- 450 E Lockwood Ave Unit 303
- 7826 Grove Ave
- 106 Mason Ave
- 7800 Murdoch Ave
- 475 Catalina Ave
- 544 Summit Ave
- 7740 Arlington Ave
- 8361 Big Bend Blvd
- 25 Saint Charles Place
- 7809 Kenridge Ln
- 619 N Bompart Ave
- 5319 Chapelford Ln
- 426 Pasadena Ave
- 650 Clark Ave
- 324 Stark Ct
- 517 Clark Ave
- 439 Landscape Ct
- 404 Clark Ave
- 5314 N Kenrick Parke Dr Unit 4
Your Personal Tour Guide
Ask me questions while you tour the home.