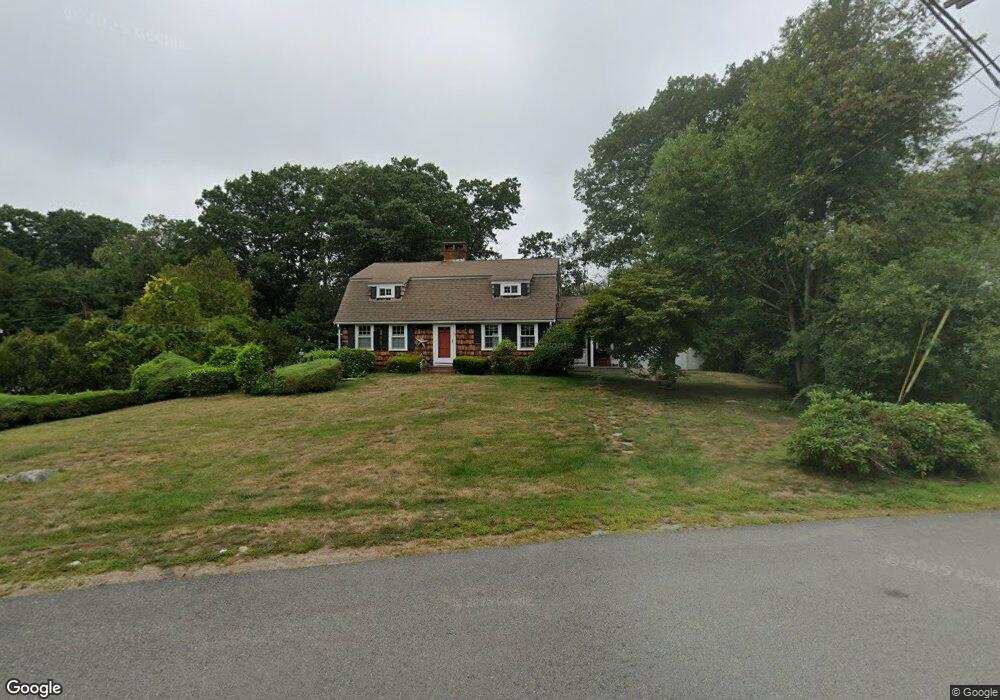
50 Summit Rd Abington, MA 02351
Estimated Value: $720,486 - $907,000
4
Beds
2
Baths
2,546
Sq Ft
$321/Sq Ft
Est. Value
About This Home
This home is located at 50 Summit Rd, Abington, MA 02351 and is currently estimated at $817,372, approximately $321 per square foot. 50 Summit Rd is a home located in Plymouth County with nearby schools including Woodsdale School, Beaver Brook Elementary School, and Abington Middle School.
Ownership History
Date
Name
Owned For
Owner Type
Purchase Details
Closed on
Apr 15, 2005
Sold by
Monson Melvin S and Monson Gail A
Bought by
Schraut David W and Schraut Jane C
Current Estimated Value
Purchase Details
Closed on
Mar 10, 2003
Sold by
Monson Melvin S and Monson Gail A
Bought by
Monson Melvin S and Monson Gail A
Create a Home Valuation Report for This Property
The Home Valuation Report is an in-depth analysis detailing your home's value as well as a comparison with similar homes in the area
Home Values in the Area
Average Home Value in this Area
Purchase History
| Date | Buyer | Sale Price | Title Company |
|---|---|---|---|
| Schraut David W | $529,900 | -- | |
| Monson Melvin S | -- | -- |
Source: Public Records
Mortgage History
| Date | Status | Borrower | Loan Amount |
|---|---|---|---|
| Open | Monson Melvin S | $37,000 | |
| Open | Monson Melvin S | $296,250 | |
| Closed | Monson Melvin S | $37,000 |
Source: Public Records
Tax History
| Year | Tax Paid | Tax Assessment Tax Assessment Total Assessment is a certain percentage of the fair market value that is determined by local assessors to be the total taxable value of land and additions on the property. | Land | Improvement |
|---|---|---|---|---|
| 2025 | $8,558 | $655,300 | $269,500 | $385,800 |
| 2024 | $8,302 | $620,500 | $245,600 | $374,900 |
| 2023 | $7,921 | $557,400 | $223,900 | $333,500 |
| 2022 | $7,765 | $510,200 | $187,600 | $322,600 |
| 2021 | $7,136 | $433,000 | $171,500 | $261,500 |
| 2020 | $7,268 | $427,500 | $172,700 | $254,800 |
| 2019 | $7,191 | $413,500 | $165,800 | $247,700 |
| 2018 | $6,880 | $386,100 | $165,800 | $220,300 |
| 2017 | $6,901 | $376,100 | $165,800 | $210,300 |
| 2016 | $6,320 | $352,500 | $151,600 | $200,900 |
| 2015 | $6,001 | $353,000 | $151,600 | $201,400 |
Source: Public Records
Map
Nearby Homes
- 337 Randolph St
- 120 Temple St
- 1077 Bedford St
- 1353 Washington St
- 0 Bedford St
- 66 Coleman St
- 338 Adams St
- 590 Adams St
- 56 Townsend St Unit D26
- 22 Kingswood Dr Unit 6F
- 14 Jamieson St
- 451 Lincoln St
- 120 Glen St
- 720 Hancock St
- 44 Old Forge Rd
- 189 Sheri Ln
- 332 Hancock St
- 73 Monroe St
- 1639 Main St
- 42 Van Buren Dr
Your Personal Tour Guide
Ask me questions while you tour the home.