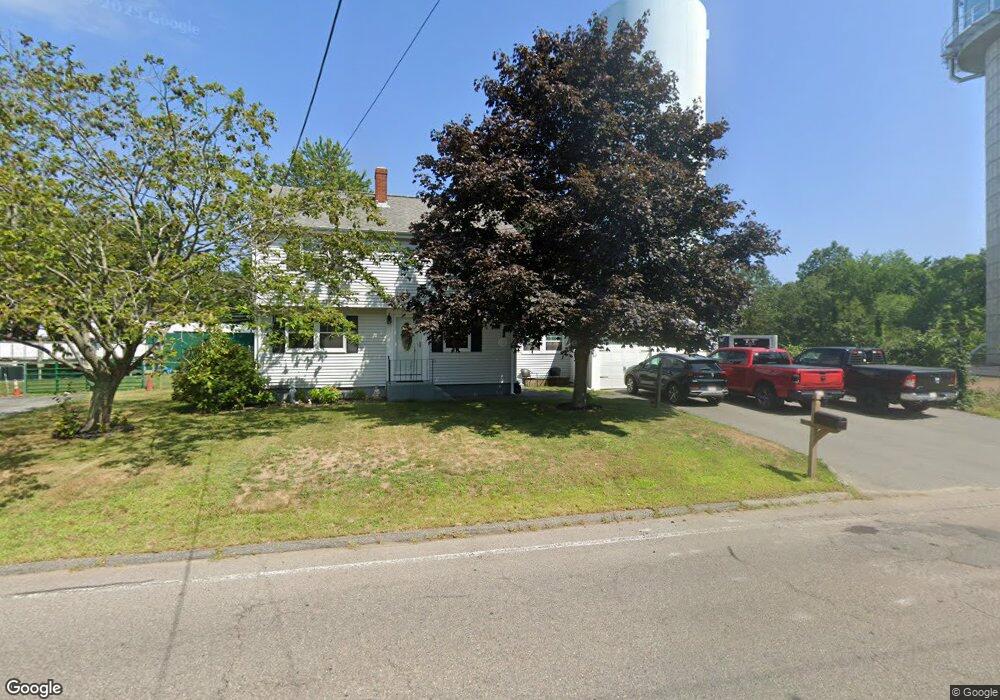
50 Sycamore St Holbrook, MA 02343
Estimated Value: $530,052 - $589,000
3
Beds
2
Baths
1,400
Sq Ft
$403/Sq Ft
Est. Value
About This Home
This home is located at 50 Sycamore St, Holbrook, MA 02343 and is currently estimated at $564,763, approximately $403 per square foot. 50 Sycamore St is a home located in Norfolk County with nearby schools including John F. Kennedy Elementary School, Holbrook Middle High School, and Boston Higashi School.
Ownership History
Date
Name
Owned For
Owner Type
Purchase Details
Closed on
Jun 26, 2025
Sold by
Dunne Kevin M and Dunne Michelle A
Bought by
Dunne Rt and Dunne
Current Estimated Value
Purchase Details
Closed on
Aug 7, 1990
Sold by
Dunne John J
Bought by
Dunne Kevin M
Create a Home Valuation Report for This Property
The Home Valuation Report is an in-depth analysis detailing your home's value as well as a comparison with similar homes in the area
Home Values in the Area
Average Home Value in this Area
Purchase History
| Date | Buyer | Sale Price | Title Company |
|---|---|---|---|
| Dunne Rt | -- | -- | |
| Dunne Kevin M | $125,000 | -- | |
| Dunne Kevin M | $125,000 | -- |
Source: Public Records
Mortgage History
| Date | Status | Borrower | Loan Amount |
|---|---|---|---|
| Previous Owner | Dunne Kevin M | $25,000 | |
| Previous Owner | Dunne Kevin M | $10,000 | |
| Previous Owner | Dunne Kevin M | $99,900 |
Source: Public Records
Tax History Compared to Growth
Tax History
| Year | Tax Paid | Tax Assessment Tax Assessment Total Assessment is a certain percentage of the fair market value that is determined by local assessors to be the total taxable value of land and additions on the property. | Land | Improvement |
|---|---|---|---|---|
| 2025 | $6,106 | $463,300 | $247,400 | $215,900 |
| 2024 | $5,728 | $426,200 | $213,700 | $212,500 |
| 2023 | $6,021 | $391,500 | $204,500 | $187,000 |
| 2022 | $5,618 | $340,700 | $174,300 | $166,400 |
| 2021 | $5,567 | $323,300 | $162,900 | $160,400 |
| 2020 | $5,577 | $303,600 | $150,300 | $153,300 |
| 2019 | $5,632 | $289,400 | $143,100 | $146,300 |
| 2018 | $5,368 | $259,700 | $117,000 | $142,700 |
| 2017 | $5,106 | $244,300 | $106,400 | $137,900 |
| 2016 | $4,686 | $238,600 | $104,400 | $134,200 |
| 2015 | $4,268 | $223,700 | $96,700 | $127,000 |
| 2014 | $4,109 | $218,900 | $96,700 | $122,200 |
Source: Public Records
Map
Nearby Homes
- 22 Medallion Rd
- 169 Pond St
- 45-R Ernest St
- 360 Plymouth St
- 187 Belcher St
- 148 N Franklin St
- 373 N Franklin St
- 181 S Franklin St Unit 102
- 152 S Franklin St
- 88 Roseen Rd
- 27 Winter St
- 35 Marion St
- 5 Clarendon Cir Unit Lot 4
- 45 King Rd
- 134 Tyson Commons Ln
- 30 Bradford Commons Ln
- 63 Cedarhill Rd
- 14 Fern Rd
- 1501 Liberty St
- 104 Milton Rd