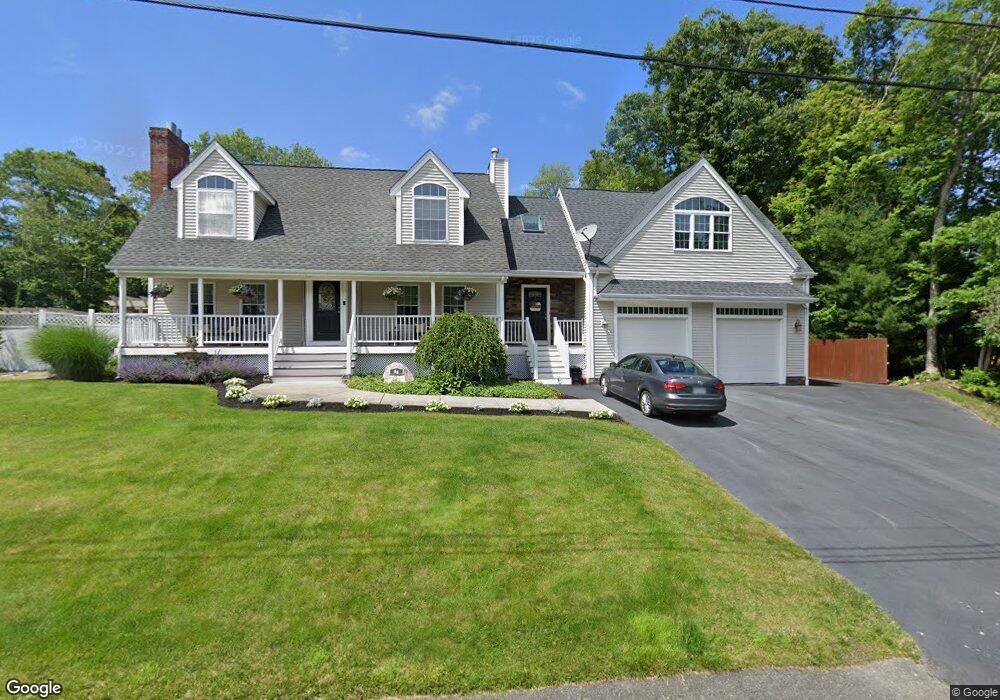
50 Sylvana St Westport, MA 02790
North Westport NeighborhoodEstimated Value: $587,000 - $698,000
3
Beds
--
Bath
2,347
Sq Ft
$271/Sq Ft
Est. Value
About This Home
This home is located at 50 Sylvana St, Westport, MA 02790 and is currently estimated at $635,423, approximately $270 per square foot. 50 Sylvana St is a home located in Bristol County with nearby schools including Alice A. Macomber Primary School, Westport Elementary School, and Westport Middle-High School.
Ownership History
Date
Name
Owned For
Owner Type
Purchase Details
Closed on
Jul 5, 2011
Sold by
Horta Christopher T and Rapoza Michelle
Bought by
Horta Christopher T and Horta Michelle
Current Estimated Value
Home Financials for this Owner
Home Financials are based on the most recent Mortgage that was taken out on this home.
Original Mortgage
$155,000
Outstanding Balance
$11,703
Interest Rate
4.62%
Mortgage Type
Purchase Money Mortgage
Estimated Equity
$623,720
Purchase Details
Closed on
Jun 30, 1998
Sold by
Goss Marilyn
Bought by
Horta Christopher T and Rapoza Michelle
Home Financials for this Owner
Home Financials are based on the most recent Mortgage that was taken out on this home.
Original Mortgage
$97,600
Interest Rate
7.09%
Mortgage Type
Purchase Money Mortgage
Create a Home Valuation Report for This Property
The Home Valuation Report is an in-depth analysis detailing your home's value as well as a comparison with similar homes in the area
Home Values in the Area
Average Home Value in this Area
Purchase History
| Date | Buyer | Sale Price | Title Company |
|---|---|---|---|
| Horta Christopher T | -- | -- | |
| Horta Christopher T | $122,000 | -- |
Source: Public Records
Mortgage History
| Date | Status | Borrower | Loan Amount |
|---|---|---|---|
| Open | Horta Christopher T | $155,000 | |
| Previous Owner | Horta Christopher T | $40,000 | |
| Previous Owner | Horta Christopher T | $172,000 | |
| Previous Owner | Horta Christopher T | $96,000 | |
| Previous Owner | Horta Christopher T | $97,600 |
Source: Public Records
Tax History Compared to Growth
Tax History
| Year | Tax Paid | Tax Assessment Tax Assessment Total Assessment is a certain percentage of the fair market value that is determined by local assessors to be the total taxable value of land and additions on the property. | Land | Improvement |
|---|---|---|---|---|
| 2025 | $4,207 | $564,700 | $161,900 | $402,800 |
| 2024 | $4,217 | $545,500 | $150,000 | $395,500 |
| 2023 | $4,168 | $510,800 | $136,600 | $374,200 |
| 2022 | $3,751 | $442,300 | $124,200 | $318,100 |
| 2021 | $4,156 | $431,000 | $112,900 | $318,100 |
| 2020 | $4,009 | $369,100 | $108,400 | $260,700 |
| 2019 | $3,090 | $373,600 | $108,400 | $265,200 |
| 2018 | $3,218 | $334,000 | $116,600 | $217,400 |
| 2017 | $2,732 | $342,800 | $116,600 | $226,200 |
| 2016 | $2,637 | $333,400 | $116,600 | $216,800 |
| 2015 | $2,549 | $321,500 | $116,600 | $204,900 |
Source: Public Records
Map
Nearby Homes