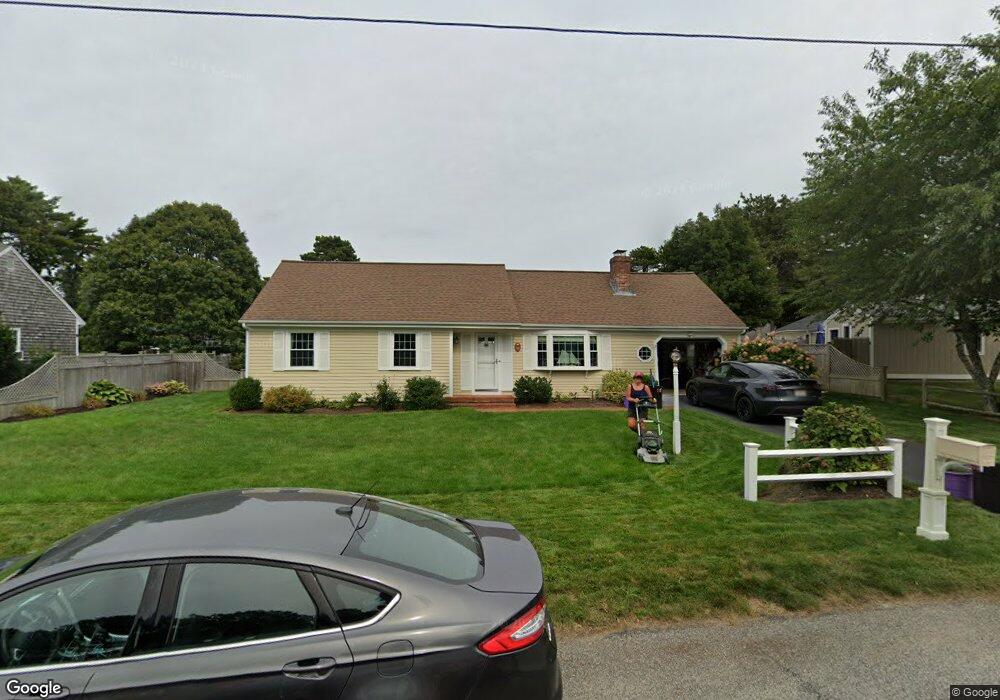
50 Taft Rd West Yarmouth, MA 02673
South Yarmouth NeighborhoodEstimated Value: $554,000 - $588,000
3
Beds
2
Baths
1,148
Sq Ft
$497/Sq Ft
Est. Value
About This Home
This home is located at 50 Taft Rd, West Yarmouth, MA 02673 and is currently estimated at $570,980, approximately $497 per square foot. 50 Taft Rd is a home located in Barnstable County with nearby schools including Dennis-Yarmouth Regional High School, Sturgis Charter Public School, and St. Pius X. School.
Ownership History
Date
Name
Owned For
Owner Type
Purchase Details
Closed on
Jun 2, 2021
Sold by
Haney William
Bought by
Joseph Austin E and Joseph Marie E
Current Estimated Value
Home Financials for this Owner
Home Financials are based on the most recent Mortgage that was taken out on this home.
Original Mortgage
$350,000
Outstanding Balance
$316,881
Interest Rate
2.9%
Mortgage Type
Purchase Money Mortgage
Estimated Equity
$254,099
Purchase Details
Closed on
Feb 28, 2017
Sold by
Haney Elizabeth
Bought by
Haney William
Purchase Details
Closed on
Sep 25, 2009
Sold by
Tinsley E Paul
Bought by
Haney William and Haney Elizabeth
Home Financials for this Owner
Home Financials are based on the most recent Mortgage that was taken out on this home.
Original Mortgage
$207,000
Interest Rate
5.31%
Mortgage Type
Purchase Money Mortgage
Purchase Details
Closed on
May 11, 2006
Sold by
Alberico Sandra J
Bought by
Tinsley E Paul
Home Financials for this Owner
Home Financials are based on the most recent Mortgage that was taken out on this home.
Original Mortgage
$236,250
Interest Rate
6.4%
Mortgage Type
Purchase Money Mortgage
Purchase Details
Closed on
Aug 25, 2000
Sold by
Garofano Joseph E
Bought by
Alberico Sandra J
Home Financials for this Owner
Home Financials are based on the most recent Mortgage that was taken out on this home.
Original Mortgage
$130,000
Interest Rate
8.06%
Mortgage Type
Purchase Money Mortgage
Purchase Details
Closed on
Jul 2, 1998
Sold by
Barnes Rosiland and Veno Randall D
Bought by
Garofano Joseph E
Home Financials for this Owner
Home Financials are based on the most recent Mortgage that was taken out on this home.
Original Mortgage
$80,000
Interest Rate
7.04%
Mortgage Type
Purchase Money Mortgage
Purchase Details
Closed on
Aug 21, 1995
Sold by
Shea Marilyn Louise and Shea Charles E
Bought by
Barnes Rosiland and Veno Randall D
Home Financials for this Owner
Home Financials are based on the most recent Mortgage that was taken out on this home.
Original Mortgage
$68,000
Interest Rate
7.61%
Mortgage Type
Purchase Money Mortgage
Create a Home Valuation Report for This Property
The Home Valuation Report is an in-depth analysis detailing your home's value as well as a comparison with similar homes in the area
Home Values in the Area
Average Home Value in this Area
Purchase History
| Date | Buyer | Sale Price | Title Company |
|---|---|---|---|
| Joseph Austin E | $450,000 | None Available | |
| Haney William | -- | -- | |
| Haney William | $259,000 | -- | |
| Tinsley E Paul | $315,000 | -- | |
| Alberico Sandra J | $145,000 | -- | |
| Garofano Joseph E | $92,000 | -- | |
| Barnes Rosiland | $85,000 | -- |
Source: Public Records
Mortgage History
| Date | Status | Borrower | Loan Amount |
|---|---|---|---|
| Open | Joseph Austin E | $350,000 | |
| Previous Owner | Haney William | $207,000 | |
| Previous Owner | Tinsley E Paul | $236,250 | |
| Previous Owner | Alberico Sandra J | $130,000 | |
| Previous Owner | Garofano Joseph E | $80,000 | |
| Previous Owner | Barnes Rosiland | $68,000 |
Source: Public Records
Tax History Compared to Growth
Tax History
| Year | Tax Paid | Tax Assessment Tax Assessment Total Assessment is a certain percentage of the fair market value that is determined by local assessors to be the total taxable value of land and additions on the property. | Land | Improvement |
|---|---|---|---|---|
| 2025 | $3,442 | $486,200 | $143,200 | $343,000 |
| 2024 | $3,295 | $446,500 | $131,500 | $315,000 |
| 2023 | $3,257 | $401,600 | $122,000 | $279,600 |
| 2022 | $3,363 | $366,300 | $114,400 | $251,900 |
| 2021 | $3,132 | $327,600 | $114,400 | $213,200 |
| 2020 | $3,044 | $304,400 | $114,400 | $190,000 |
| 2019 | $2,794 | $276,600 | $114,400 | $162,200 |
| 2018 | $2,671 | $259,600 | $97,400 | $162,200 |
| 2017 | $2,559 | $255,400 | $93,200 | $162,200 |
| 2016 | $2,464 | $246,900 | $84,700 | $162,200 |
| 2015 | $2,324 | $231,500 | $84,700 | $146,800 |
Source: Public Records
Map
Nearby Homes
- 24 Fast Brook Rd
- 11 Bob-O-link Ln
- 33 Lake Rd
- 274 Winslow Gray Rd
- 23 Circuit Rd N
- 68 Bob-O-link Ln
- 20 Robin Rd
- 18 Captain Stanley Rd
- 48 Captain Dore Rd
- 35 Captain Percival Rd
- 255 Long Pond Dr
- 3 Saturn Ln
- 2 Ocean Spray Ln
- 49 Captain Besse Rd
- 147 Captain Bacon Rd
- 62 Danas Path
- 844 Route 28 Unit 2A
- 844 Route 28 Unit 9B
- 844 Route 28 Unit 2A