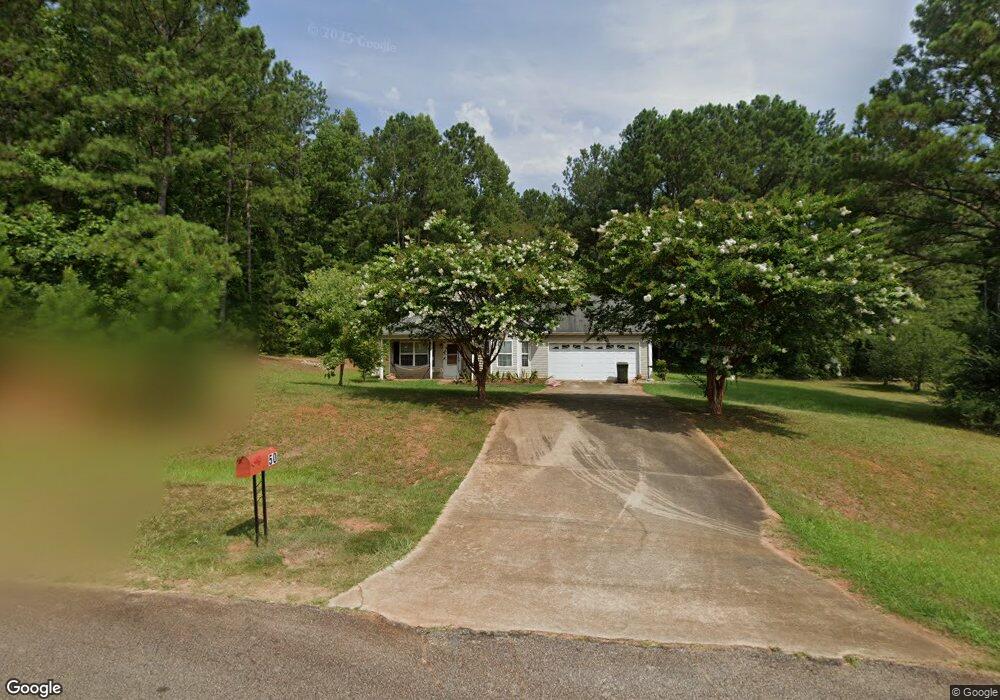
50 Tomkins Creek Trail Unit 9 Forsyth, GA 31029
Estimated Value: $225,000 - $236,000
3
Beds
2
Baths
1,400
Sq Ft
$164/Sq Ft
Est. Value
About This Home
This home is located at 50 Tomkins Creek Trail Unit 9, Forsyth, GA 31029 and is currently estimated at $229,732, approximately $164 per square foot. 50 Tomkins Creek Trail Unit 9 is a home located in Monroe County with nearby schools including Katherine B. Sutton Elementary School and Mary Persons High School.
Ownership History
Date
Name
Owned For
Owner Type
Purchase Details
Closed on
Nov 23, 2016
Sold by
Frances
Bought by
Copelan Ashley B
Current Estimated Value
Home Financials for this Owner
Home Financials are based on the most recent Mortgage that was taken out on this home.
Original Mortgage
$119,191
Outstanding Balance
$95,840
Interest Rate
3.47%
Mortgage Type
New Conventional
Estimated Equity
$133,892
Purchase Details
Closed on
Jun 6, 2013
Sold by
Hickman Justin
Bought by
Murphy Frances
Home Financials for this Owner
Home Financials are based on the most recent Mortgage that was taken out on this home.
Original Mortgage
$117,346
Interest Rate
3.42%
Mortgage Type
New Conventional
Purchase Details
Closed on
Aug 18, 2006
Sold by
Not Provided
Bought by
Hickman Justin and Hickman Elizabeth
Home Financials for this Owner
Home Financials are based on the most recent Mortgage that was taken out on this home.
Original Mortgage
$109,112
Interest Rate
6.73%
Mortgage Type
FHA
Create a Home Valuation Report for This Property
The Home Valuation Report is an in-depth analysis detailing your home's value as well as a comparison with similar homes in the area
Home Values in the Area
Average Home Value in this Area
Purchase History
| Date | Buyer | Sale Price | Title Company |
|---|---|---|---|
| Copelan Ashley B | $118,000 | -- | |
| Murphy Frances | $115,000 | -- | |
| Hickman Justin | $110,600 | -- | |
| Hickman Justin | -- | -- |
Source: Public Records
Mortgage History
| Date | Status | Borrower | Loan Amount |
|---|---|---|---|
| Open | Copelan Ashley B | $119,191 | |
| Previous Owner | Murphy Frances | $117,346 | |
| Previous Owner | Hickman Justin | $109,112 |
Source: Public Records
Tax History Compared to Growth
Tax History
| Year | Tax Paid | Tax Assessment Tax Assessment Total Assessment is a certain percentage of the fair market value that is determined by local assessors to be the total taxable value of land and additions on the property. | Land | Improvement |
|---|---|---|---|---|
| 2024 | $1,212 | $55,040 | $10,000 | $45,040 |
| 2023 | $1,163 | $53,160 | $10,000 | $43,160 |
| 2022 | $1,114 | $53,160 | $10,000 | $43,160 |
| 2021 | $1,154 | $53,160 | $10,000 | $43,160 |
| 2020 | $1,127 | $51,240 | $10,000 | $41,240 |
| 2019 | $1,136 | $51,240 | $10,000 | $41,240 |
| 2018 | $1,093 | $49,640 | $5,600 | $44,040 |
| 2017 | $1,443 | $49,640 | $5,600 | $44,040 |
| 2016 | $881 | $43,880 | $5,600 | $38,280 |
| 2015 | $836 | $43,880 | $5,600 | $38,280 |
| 2014 | $807 | $43,880 | $5,600 | $38,280 |
Source: Public Records
Map
Nearby Homes
- 110 Tomkins Creek Trail
- 83 Sydney Woods Dr
- 2023 Camberle Ct
- 2023 Camberle Ct Unit 144
- 1082 Victorian Blvd
- 67 Strickland Loop
- 410 Strickland Loop
- 4320 Cornwall Dr
- 5343 Felles Way
- 5357 Felles Way Unit 378
- 4686 Johnstonville Rd
- 3355 Sr 42 N
- 3355 Georgia 42
- 68 Creekview Dr
- 80 S Cedar Creek Dr
- 29 Deer Run
- 62 S Cedar Creek Dr
- 4631 Capulet Ct Unit 331
- 4631 Capulet Ct
- 90 +/- ACRES English Rd
- 50 Tomkins Creek Trail
- 68 Tomkins Creek Trail Unit 10
- 68 Tomkins Creek Trail
- 68 Tomkins Creek Trail Unit 16
- 36 Tompkins Creek Trail
- 48 W Sydney Woods Dr
- 45 Tomkins Creek Trail
- 77 Tomkins Creek Trail
- 37 E Sydney Woods Dr
- 116 Sydney Woods Dr
- 49 W Sydney Woods Dr
- 49 W Sydney Woods Dr Unit 12
- 38 E Sydney Woods Dr
- 94 Tomkins Creek Trail
- 100 Sydney Woods Dr
- 130 Sydney Woods Dr
- 93 Tomkins Creek Trail
- 146 Sydney Woods Dr
- 111 Tomkins Creek Trail
- 2483 Ga Highway 42 N