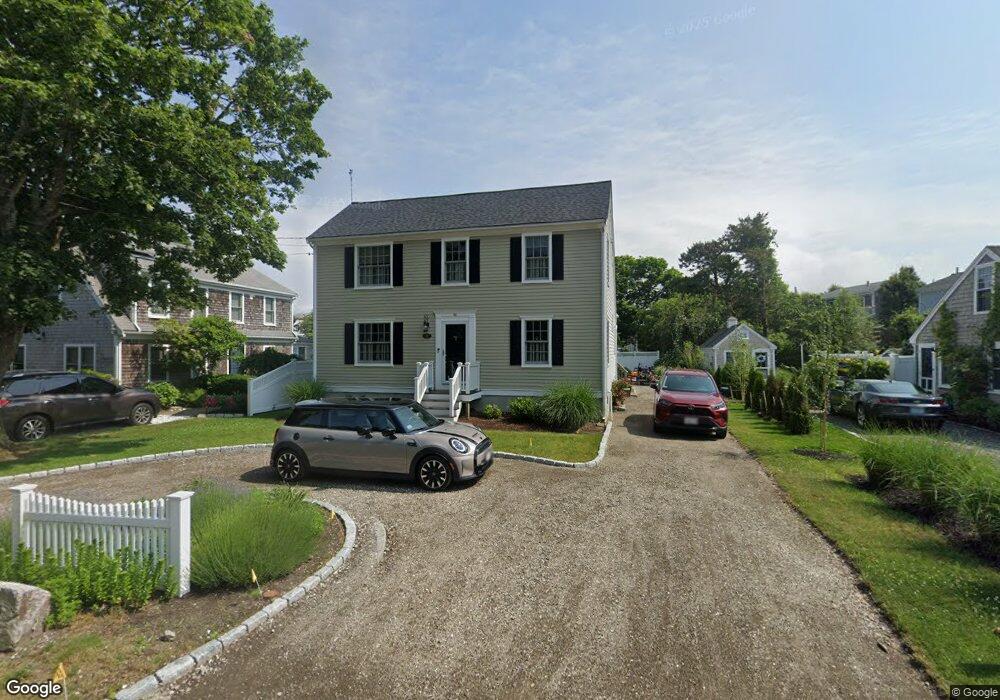
50 Town Neck Rd Sandwich, MA 02563
Estimated Value: $821,532 - $876,000
3
Beds
2
Baths
1,440
Sq Ft
$592/Sq Ft
Est. Value
About This Home
This home is located at 50 Town Neck Rd, Sandwich, MA 02563 and is currently estimated at $852,383, approximately $591 per square foot. 50 Town Neck Rd is a home located in Barnstable County with nearby schools including Sandwich Middle High School, Waldorf School of Cape Cod, and Bridgeview Montessori School.
Ownership History
Date
Name
Owned For
Owner Type
Purchase Details
Closed on
Sep 27, 2002
Sold by
Lawrence Henry T and Lawrence Grace M
Bought by
Mazzone Charles R and Mazzone Elizabeth A
Current Estimated Value
Home Financials for this Owner
Home Financials are based on the most recent Mortgage that was taken out on this home.
Original Mortgage
$292,000
Outstanding Balance
$123,224
Interest Rate
6.25%
Mortgage Type
Purchase Money Mortgage
Estimated Equity
$729,159
Purchase Details
Closed on
Aug 7, 1997
Sold by
Colomb William A
Bought by
Iadonisi Jeffrey G
Create a Home Valuation Report for This Property
The Home Valuation Report is an in-depth analysis detailing your home's value as well as a comparison with similar homes in the area
Home Values in the Area
Average Home Value in this Area
Purchase History
| Date | Buyer | Sale Price | Title Company |
|---|---|---|---|
| Mazzone Charles R | $365,000 | -- | |
| Iadonisi Jeffrey G | $26,000 | -- |
Source: Public Records
Mortgage History
| Date | Status | Borrower | Loan Amount |
|---|---|---|---|
| Open | Mazzone Charles R | $292,000 |
Source: Public Records
Tax History Compared to Growth
Tax History
| Year | Tax Paid | Tax Assessment Tax Assessment Total Assessment is a certain percentage of the fair market value that is determined by local assessors to be the total taxable value of land and additions on the property. | Land | Improvement |
|---|---|---|---|---|
| 2025 | $7,442 | $704,100 | $391,200 | $312,900 |
| 2024 | $6,756 | $625,600 | $326,300 | $299,300 |
| 2023 | $6,542 | $568,900 | $296,600 | $272,300 |
| 2022 | $6,069 | $461,200 | $238,300 | $222,900 |
| 2021 | $5,946 | $431,800 | $229,100 | $202,700 |
| 2020 | $5,780 | $403,900 | $209,300 | $194,600 |
| 2019 | $5,520 | $385,500 | $203,400 | $182,100 |
| 2018 | $5,089 | $356,100 | $184,700 | $171,400 |
| 2017 | $4,942 | $331,000 | $171,100 | $159,900 |
| 2016 | $4,735 | $327,200 | $169,400 | $157,800 |
| 2015 | $4,653 | $314,000 | $159,400 | $154,600 |
Source: Public Records
Map
Nearby Homes