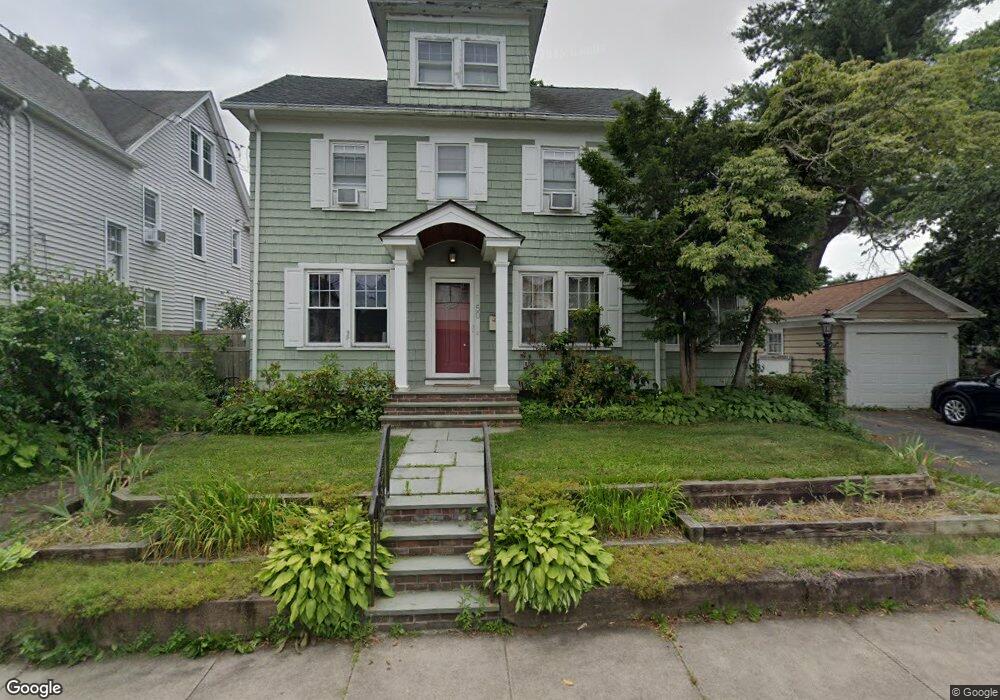
50 Treadwell St Hamden, CT 06517
Estimated Value: $355,324 - $458,000
3
Beds
1
Bath
1,702
Sq Ft
$226/Sq Ft
Est. Value
About This Home
This home is located at 50 Treadwell St, Hamden, CT 06517 and is currently estimated at $384,331, approximately $225 per square foot. 50 Treadwell St is a home located in New Haven County with nearby schools including Hamden Middle School, Hamden High School, and Hamden Hall Country Day School.
Ownership History
Date
Name
Owned For
Owner Type
Purchase Details
Closed on
Apr 7, 2010
Sold by
Macdougall Kevin B and Macdougall Sarah C
Bought by
Harwell Andrei S and Mckee Valerie
Current Estimated Value
Home Financials for this Owner
Home Financials are based on the most recent Mortgage that was taken out on this home.
Original Mortgage
$184,000
Outstanding Balance
$122,801
Interest Rate
5.12%
Estimated Equity
$261,530
Purchase Details
Closed on
May 30, 2002
Sold by
Barber Grant and Barber Denise F
Bought by
Anderson Sarah C and Macdougall Kevin B
Purchase Details
Closed on
Apr 30, 2002
Sold by
Barber Grant and Barber Dnise F
Bought by
Anderson Sarah C and Macdougall Kevin B
Purchase Details
Closed on
Oct 1, 1990
Sold by
Stephens Joel C
Bought by
Barter Grant
Purchase Details
Closed on
Aug 17, 1987
Sold by
Goodman Robert
Bought by
Stephens Joel C
Purchase Details
Closed on
Apr 7, 1987
Sold by
Savarese Louis F
Bought by
Goodman Robert
Create a Home Valuation Report for This Property
The Home Valuation Report is an in-depth analysis detailing your home's value as well as a comparison with similar homes in the area
Home Values in the Area
Average Home Value in this Area
Purchase History
| Date | Buyer | Sale Price | Title Company |
|---|---|---|---|
| Harwell Andrei S | $230,000 | -- | |
| Anderson Sarah C | $130,000 | -- | |
| Anderson Sarah C | $130,000 | -- | |
| Barter Grant | $160,000 | -- | |
| Stephens Joel C | $162,800 | -- | |
| Goodman Robert | $135,000 | -- |
Source: Public Records
Mortgage History
| Date | Status | Borrower | Loan Amount |
|---|---|---|---|
| Open | Goodman Robert | $184,000 | |
| Previous Owner | Goodman Robert | $176,250 |
Source: Public Records
Tax History
| Year | Tax Paid | Tax Assessment Tax Assessment Total Assessment is a certain percentage of the fair market value that is determined by local assessors to be the total taxable value of land and additions on the property. | Land | Improvement |
|---|---|---|---|---|
| 2025 | $11,839 | $228,200 | $62,720 | $165,480 |
| 2024 | $8,646 | $155,470 | $45,640 | $109,830 |
| 2023 | $8,758 | $155,330 | $45,640 | $109,690 |
| 2022 | $8,618 | $155,330 | $45,640 | $109,690 |
| 2021 | $8,146 | $155,330 | $45,640 | $109,690 |
| 2020 | $7,688 | $147,910 | $59,430 | $88,480 |
| 2019 | $7,227 | $147,910 | $59,430 | $88,480 |
| 2018 | $7,094 | $147,910 | $59,430 | $88,480 |
| 2017 | $6,694 | $147,910 | $59,430 | $88,480 |
| 2016 | $6,709 | $147,910 | $59,430 | $88,480 |
| 2015 | $6,652 | $162,750 | $68,670 | $94,080 |
| 2014 | $6,499 | $162,750 | $68,670 | $94,080 |
Source: Public Records
Map
Nearby Homes
- 44 Lake St
- 2022 Whitney Ave
- 210 Treadwell St Unit 310
- 210 Treadwell St Unit 405
- 1412 Whitney Ave Unit J1
- 1414 Whitney Ave Unit E3
- 1204 Whitney Ave Unit 207
- 1204 Whitney Ave Unit 118
- 32 Dawes Ave
- 1165 Whitney Ave
- 159 Augur St
- 1150 Whitney Ave Unit 5
- 290 Treadwell St Unit 1402
- 133 Blake Rd
- 36 Rolfe St
- 126 Hartford Turnpike
- 196 Waite St
- 36 Ford St
- 30 Coram St
- 52 Coram St
Your Personal Tour Guide
Ask me questions while you tour the home.